AI agents read TraceBug bug reports (console, network, replay, repro timeline) from local disk.
Quick Install
Automated & IDE SetupCopy the AI prompt to install this server into Claude Code, Cursor, or another agent — or use 1-click editor setup below.
Manual Client & Custom JSON ConfigExpand JSON ▾
Client Config & Setup
Choose your client or environment
Target File:
💡 Paste the JSON block into your client's configuration file under mcpServers, then restart the application.
Documentation Overview
TraceBug
Capture the bug. Let AI fix it.
Local-first, zero backend. One .html file — full replay, console
errors, network requests, repro timeline — that your AI coding agent reads over
MCP and fixes. Opens offline for humans too.
▶ Watch the 15-second demo · watch Claude debug a real bug · try it live in the sandbox





TraceBug is a local-first debugging assistant. Capture a bug → produce a single self-contained .html file → hand it to your AI coding agent (Claude Code, Cursor, Windsurf), which reads the evidence over a local MCP server and fixes it — or email/Slack it to a human dev who opens it offline. Every report also embeds a failing test the agent runs to verify the fix.
Every report opens with:
No accounts. No SaaS lock-in. Data stays in your browser by default.
Optional cloud sharing (built, UI-gated off by default): if you'd rather share a URL than a file, sign in once and get a share link with the same content. The code ships behind a feature flag (PHASE2-CLOUD); the Share button stays disabled until the portal is switched on. Local .html export is the supported sharing path today.
Works with any frontend framework: React, Angular, Vue, Next.js, Nuxt, Vite, Svelte, SvelteKit, Remix, Astro, or plain HTML.
⚡ Get Started in 30 Seconds
New here? Report your first bug in 2 minutes →
That's it. The CLI detects your framework and prints the exact 2-line snippet. Paste it into your app, run npm run dev, and you'll see the TraceBug toolbar on the right edge.
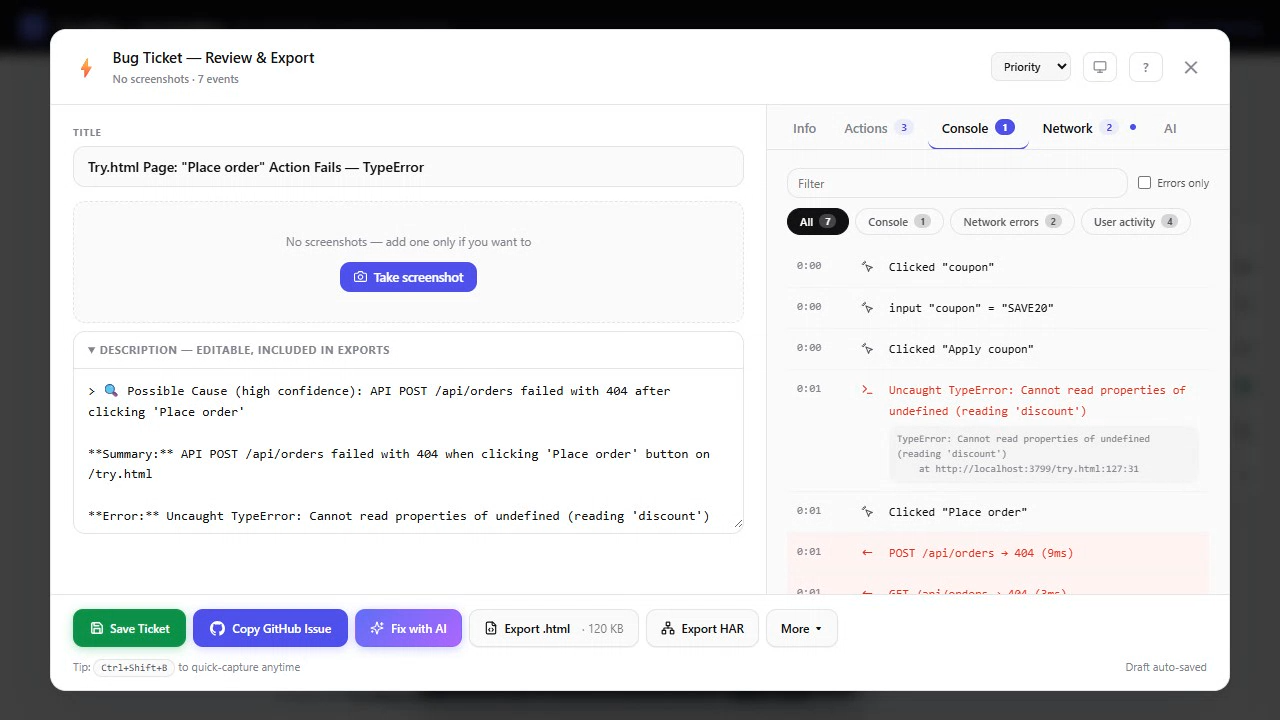
Report a bug in 2 clicks:
- Press
Ctrl+Shift+B(or click the ⚡ button on the toolbar) - Review the auto-filled report, click "Copy GitHub Issue"
- Paste into your repo. Done.
What TraceBug Does
Scan Page (a11y via axe-core, broken images, mixed content, frustration signals, failed/slow APIs, JS errors) is available programmatically as
TraceBug.scanPage(); it is no longer a toolbar button.
Two Ways to Use TraceBug
Option 1: npm Package (For Developers)
Install the SDK in your project — best for teams who want TraceBug always active on dev/staging.
Option 2: Chrome Extension (For Non-Developers)
Install the browser extension — no code needed. QA testers, PMs, and clients can use it on any website.
Install from Chrome Web Store — one click, works immediately.
| Browser | Supported |
|---|---|
| Chrome | Yes — install from Chrome Web Store |
| Edge | Yes — Chrome Web Store extensions work natively |
| Brave | Yes — Chrome Web Store extensions work natively |
| Opera | Yes — install "Install Chrome Extensions" add-on first |
| Firefox | Not yet — use the npm SDK instead |
Browser support
| Browser | npm SDK | Extension |
|---|---|---|
| Chrome | ✅ | ✅ |
| Edge | ✅ | ✅ |
| Brave / Opera | ✅ | ✅ |
| Firefox | ✅ | ⏳ (port paused — SDK only) |
| Safari | ✅¹ | ❌ (SDK only) |
The SDK is framework- and browser-agnostic — it runs anywhere modern JS runs.
¹ The interactive DOM-replay export uses the browser-native CompressionStream /
DecompressionStream (Chrome 80+, Firefox 113+, Safari 16.4+); on older engines
the exporter ships the replay uncompressed and the viewer falls back to the
screenshot gallery. The extension is Chromium-only today (Firefox port paused;
no Safari build) — on those, use the npm SDK.
Features
🧠 Debugging Assistant (v1.3)
Every report opens with four derived signals that turn "what happened" into "why it likely happened":
| Signal | What it looks like |
|---|---|
| 🔍 Root Cause Hint | "API POST /orders failed with 500 after clicking 'Place Order'" with confidence tier (high/medium/low) |
| TL;DR | One-sentence summary combining network + error + click + page signals |
| User clicked | Tag, text, selector, id, aria-label, testId for the last click before the bug |
| Recent Actions | Last ~10 user actions as plain-English steps ("Clicked 'Edit' button", "Navigated to /checkout") |
Plus:
- Network response snippets — first 200 chars of every failed
fetch/XHRresponse body, captured asynchronously (never blocks the request) - In-memory failure buffer — last 10 failed requests accessible via
TraceBug.getNetworkFailures() - Deterministic — pure functions, no AI APIs, O(1) on already-computed report fields
All four signals ship inline in GitHub issues, Jira tickets, PDF reports, and the Quick Bug modal. See docs/bug-reporting.md for full output examples.
🤖 MCP Server — AI Agents Debug Your Reports (v1.5)
Your coding agent (Claude Code, Cursor, Windsurf, VS Code) reads TraceBug bug reports and fixes the bug — fully local, nothing uploaded:
The server reads the same self-contained .html files TraceBug exports. A tester hands a dev the report file, the dev drops it in the repo, and the agent gets nine tools: list_bug_reports, get_bug_report, get_console_errors, get_network_activity, get_repro_steps, get_screenshot (real image content), get_playwright_test, resolve_stack, and get_fix_context. get_bug_report returns a prioritized investigation guide computed from what the report contains, so the agent knows exactly which tools to call next. Console stacks + failed-request bodies + repro steps + frustration signals — everything an agent needs to go from bug report to fix.
The last three close the fix loop (v1.9): get_playwright_test returns the generated failing Playwright spec that replays the session and asserts the captured failure is gone — red until the bug is fixed, green after — so the agent can run it, patch, and re-run until green. resolve_stack maps the report's minified stack frames to original source files/lines using .map files found in the repo the server runs from. get_fix_context is a one-call fix starter: the failing request with response snippet, the user action that triggered it, the source-map-resolved top stack frames, and whether a failing test is available.
Kicking off is one paste: the extension shows a ready-made agent prompt after every Export .html (auto-copied), the exported file itself carries the same prompt in its AI tab, and in Claude Code you can just type /tracebug:debug_bug_report.
Related MCP Servers
Reviews
No reviews yet — be the first to share how this listing worked for you.
Frequently Asked Questions about Tracebug
AllMCPs Directory Badge
Showcase your server listing on GitHub or your project documentation. Embed this dynamic SVG badge to highlight official listing status and live engagement.
Badge Style:
Live Dynamic SVG Preview
Markdown (GitHub README)
[](https://allmcps.com/mcp/tracebug)HTML Embed
<a href="https://allmcps.com/mcp/tracebug"><img src="https://allmcps.com/api/badge/tracebug?style=directory" alt="Tracebug on AllMCPs" /></a>Technical Specs & Signals
CategoryDeveloper Tools
27Quality signal: Emerging · 27/100How this signal is calculated ▾
Server availabilityNot measured
Not scored for repo-hosted servers — we can't reach the running server, only its GitHub page. Hosted MCP endpoints are health-checked live.
Verified ownership8/20
Documentation & tools11/30
Adoption & activity1/15
Community engagement0/10
A guidance signal from public completeness & health data — not a user rating. New listings start lower and rise as they add docs, get verified, and grow adoption. Signals we can't observe for a listing are skipped, not counted against it.
Own this project?
This directory is pre-filled from public sources. Claim via GitHub README, site badge, or DNS TXT to unlock edit access and the Official badge — proof is checked automatically, then reviewed by our team.
Free dofollow backlink: add your website and place the AllMCPs badge on it — no claim needed. We detect it automatically and keep it verified as long as the badge stays live.
Claim & get free dofollowShare & Embed
Add our SVG badge (dark/light directory styles) or embeddable widget to your site.