See what's on your ports, the processes behind them, and diagnose conflicts and leaks.
Quick Install
Automated & IDE SetupCopy the AI prompt to install this server into Claude Code, Cursor, or another agent — or use 1-click editor setup below.
One-click editor setup isn’t available for this listing yet — we don’t have a confirmed install command, and we’d rather show nothing than point your editor at the wrong package or host. Follow the project’s own setup instructions, linked above.
Manual Client & Custom JSON ConfigExpand JSON ▾
No confirmed setup config for this listing yet. We only publish a config block when the install details come from the project itself — its README, its docs, or a verified owner. We haven’t found those for portview, and we’d rather show nothing than a guess you’d paste into your client. Follow the project’s own setup instructions for the current steps.
Documentation Overview
portview



portview lists ports and the processes using them on Linux, macOS, and Windows. It shows process names, commands, memory usage, and uptime. You can inspect a port, stop its process, or monitor changes in an interactive terminal UI.
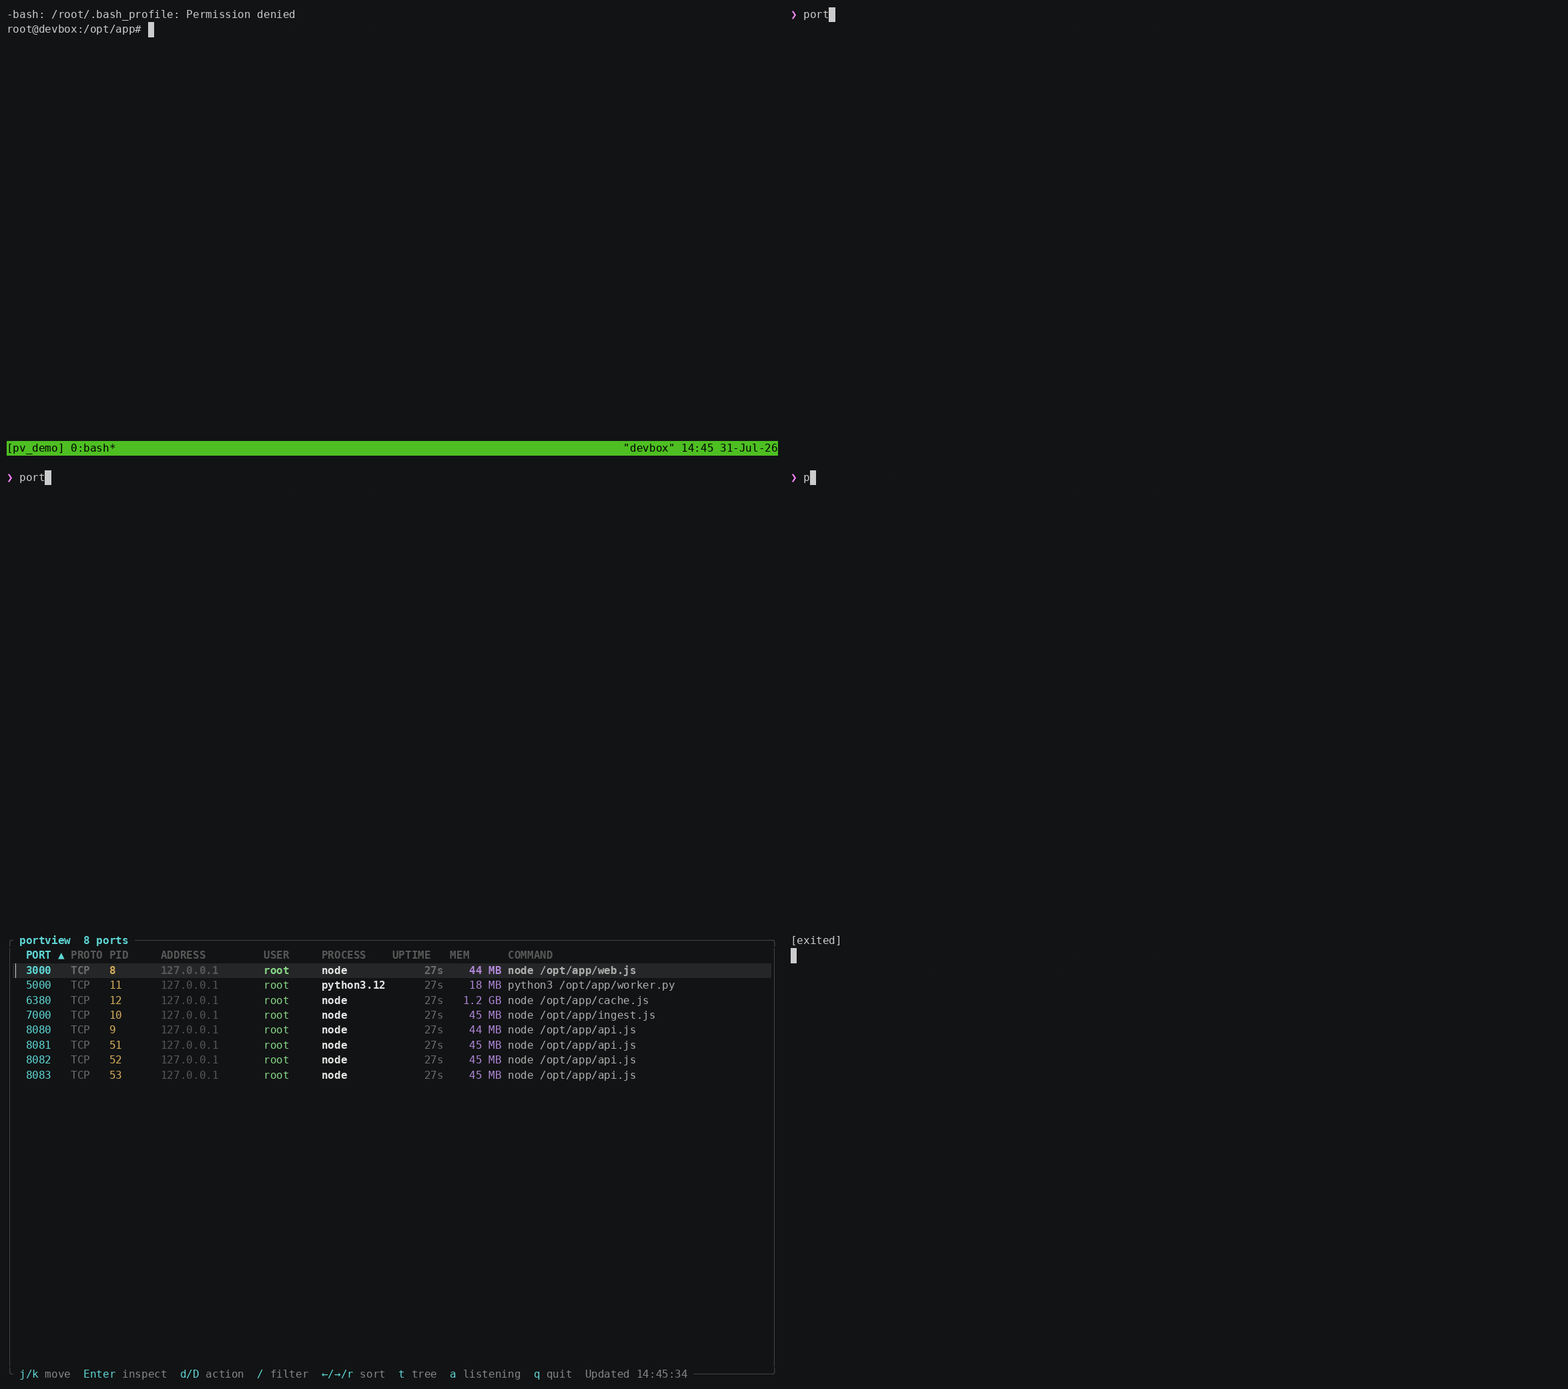
It also supports Docker, remote hosts over SSH, and an MCP server for coding agents.
Install
Homebrew:
Linux / macOS:
Windows (PowerShell):
Or use cargo install portview, or download a binary from
Releases.
What it does
Features
Scan
--all includes non-listening connections, with one row per connection.
--wide shows full commands. --json produces JSON output for scripts.
Ports whose owner can't be resolved are still listed, with - in the columns that can't be filled. That happens for another user's process without sudo, and for sockets like TIME_WAIT that outlive the process that opened them.
The scan, doctor, and MCP examples below are real output, captured by
demo/record.shinside an isolated namespace — which is why the user isrootand the paths are/opt/app. The Docker example is illustrative, since it needs a running daemon.
MCP server (for AI agents)
portview mcp provides port queries, diagnostics, and process termination over
the Model Context Protocol using stdio.
To register it with Claude Code:
Or configure it manually:
| Tool | What it does |
|---|---|
list_ports | List listening ports with available process details |
inspect_port | Inspect a port, including process working directories and descendants |
find_process | Find ports by process name or command substring |
doctor | Check for conflicts, wildcard exposure, connection buildup, and high memory usage |
diff_ports | Report ports that opened, closed, or changed owner since a baseline |
kill_port | Terminate processes using a port; dry_run previews the targets. Marked destructive to the client |
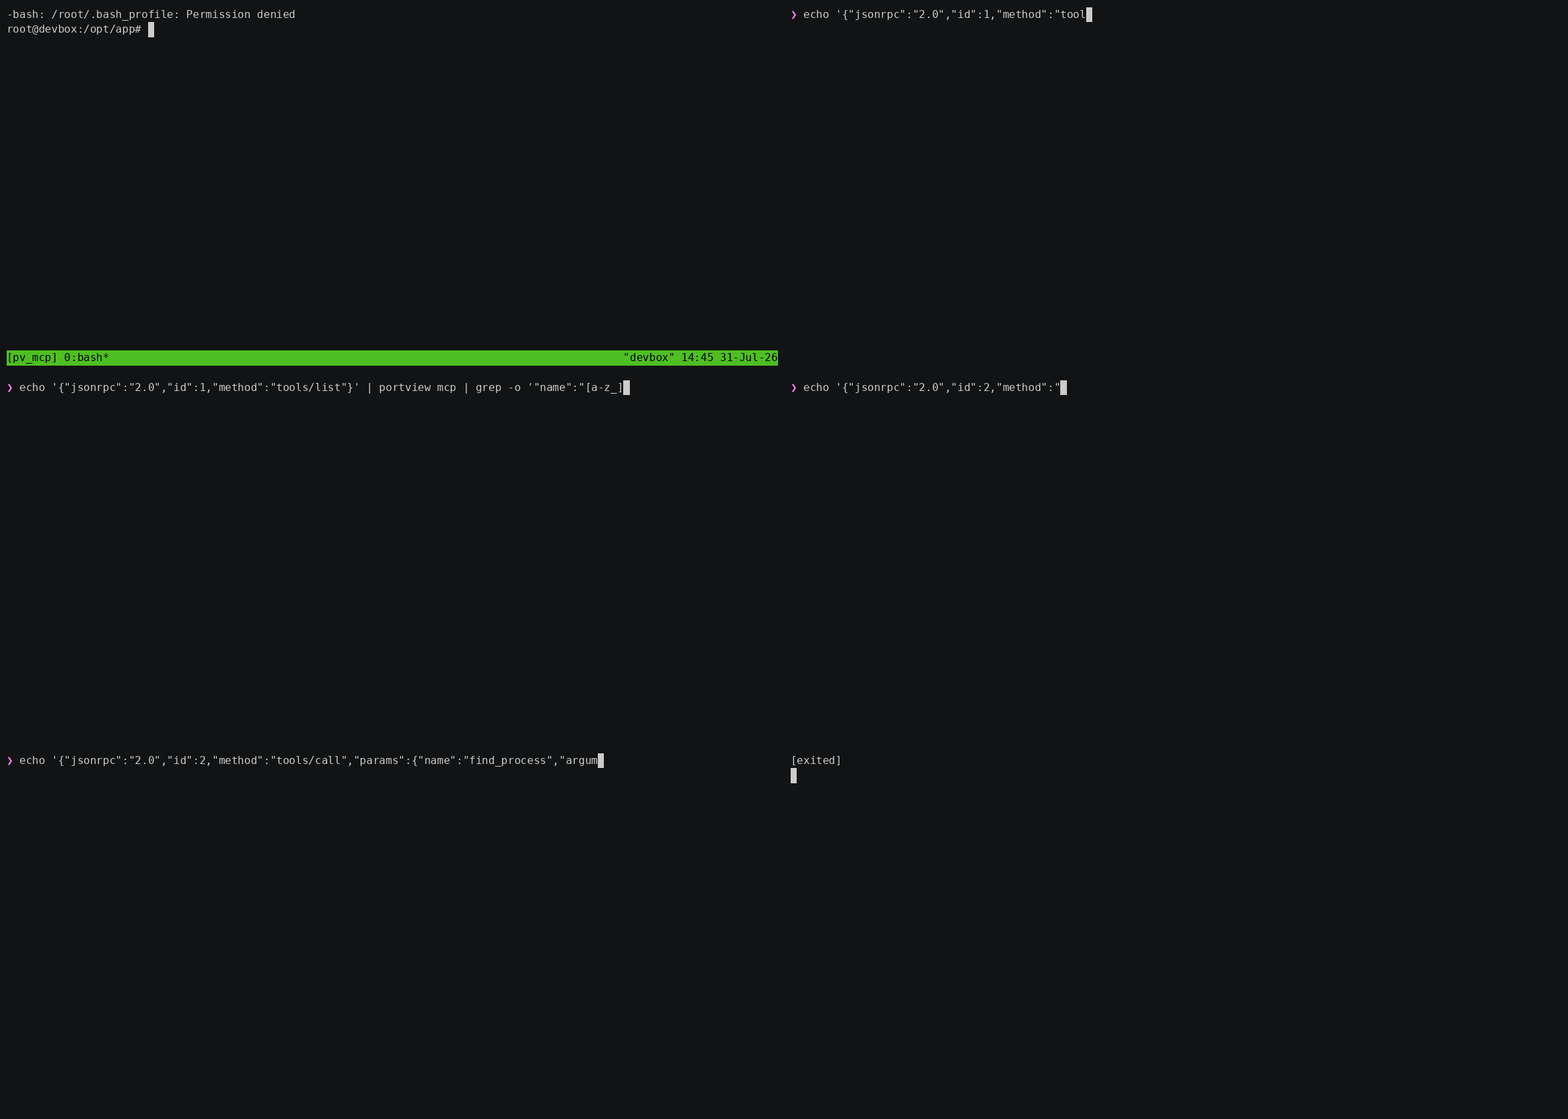
The MCP server is included in the portview binary. Pass --read-only to disable
the kill_port tool:
Listed in the MCP Registry as
mcp-name: io.github.Mapika/portview.
Watch mode (interactive TUI)
| Key | Action |
|---|---|
j/k, ↑/↓ | Navigate rows |
Enter | Inspect port (full command, cwd, children, connections) |
d/D | Kill process or manage Docker container |
/ | Filter across all columns |
←/→, r | Cycle sort column, reverse direction |
t | Toggle process tree view |
a | Toggle all/listening-only |
q | Quit |
Tree view (t): Groups child processes under their parents.
Detail view (Enter): Shows the full unwrapped command, working directory, child process list with ports, and open connections (in --all mode).
Doctor
portview doctor checks for port conflicts, wildcard bindings, connection
buildup, and high memory usage:
| Check | Flags |
|---|---|
| Port conflicts | Multiple PIDs bound to the same port |
| Wildcard exposure | Databases (postgres, redis, mysql, mongod, …) listening on 0.0.0.0 |
| Docker-host conflicts | A container publishing a port the host already uses |
| Connection buildup | High counts of TIME_WAIT or CLOSE_WAIT connections on one port; these do not by themselves establish a leak |
| High memory usage | Listening processes using more than 1 GB of resident memory |
Docker is auto-detected. portview doctor --json for scripting (exit code 1 on errors).
In CI
The GitHub Action runs doctor and can fail a workflow on errors or warnings:
It annotates each finding inline on the run, writes a summary table, and exposes
findings (JSON), count, errors, and warnings as step outputs:
Set install: false if portview is already on PATH. Linux and macOS runners.
SSH remote mode
Inspect ports on a remote host over SSH:
Kill actions in the remote TUI are forwarded over SSH.
If portview is not installed on the remote host, SSH mode collects data using
ss and ps, or lsof and ps where ss is unavailable. This requires a
POSIX shell and the collection tools on the remote host.
Use --agentless to collect data this way even when portview is installed on
the remote host. It supports scans, port inspection, process search,
diagnostics, and watch mode.
Run diagnostics on the collected data:
This uses the same diagnostic checks as local mode. The Docker check is skipped because agentless mode does not query remote containers.
Watch remote ports, with process termination available in the TUI:
Watch mode collects updates through a single persistent SSH connection.
Docker integration
Use --docker to include ports published by Docker containers:
Related MCP Servers
Adoption & maintenance
Factual signals from GitHub, npm, and our automated checks — not a rating.
GitHub stars
58
Stargazers on the source repository.
npm downloads
8
Package downloads in the last 30 days.
Last commit
1mo ago
Most recent push to the default branch.
Reviews
No reviews yet — be the first to share how this listing worked for you.
Frequently Asked Questions about Portview
AllMCPs Directory Badge
Showcase your server listing on GitHub or your project documentation. Embed this dynamic SVG badge to highlight official listing status and live engagement.
Badge Style:
Live Dynamic SVG Preview
Markdown (GitHub README)
[](https://allmcps.com/mcp/portview)HTML Embed
<a href="https://allmcps.com/mcp/portview"><img src="https://allmcps.com/api/badge/portview?style=directory" alt="Portview on AllMCPs" /></a>Technical Specs & Signals
CategoryDeveloper Tools
2/7 checks healthy over the last 45d
37Quality signal: Fair · 37/100How this signal is calculated ▾
Server availabilityNot measured
Not scored for repo-hosted servers — we can't reach the running server, only its GitHub page. Hosted MCP endpoints are health-checked live.
Verified ownership10/20
Documentation & tools11/30
Adoption & activity7/15
Community engagement0/10
A guidance signal from public completeness & health data — not a user rating. New listings start lower and rise as they add docs, get verified, and grow adoption. Signals we can't observe for a listing are skipped, not counted against it.
Own this project?
This directory is pre-filled from public sources. Claim via GitHub README, site badge, or DNS TXT to unlock edit access and the Official badge — proof is checked automatically, then reviewed by our team.
Free dofollow backlink: add your website and place the AllMCPs badge on it — no claim needed. We detect it automatically and keep it verified as long as the badge stays live.
Claim & get free dofollowShare & Embed
Add our SVG badge (dark/light directory styles) or embeddable widget to your site.