PhpCodeArcheology README
The full upstream README, mirrored here for reference. Install config, tool schemas, adoption signals, and an original overview live on the PhpCodeArcheology listing page.

PhpCodeArcheology



PhpCodeArcheology is a PHP static analysis tool that measures code quality through 60+ metrics including cyclomatic complexity, maintainability index, coupling, and cohesion. It generates comprehensive reports for files, classes, methods, and functions — detecting code smells, identifying hotspots via git churn analysis, and tracking quality trends over time.
Unlike PHPStan or Psalm (which focus on type safety and bug detection), PhpCodeArcheology focuses on architecture and maintainability — giving you the insights you need to understand and improve your codebase structure. Think of it as an alternative to PHPMetrics with deeper git integration, baseline management, and AI-ready output.
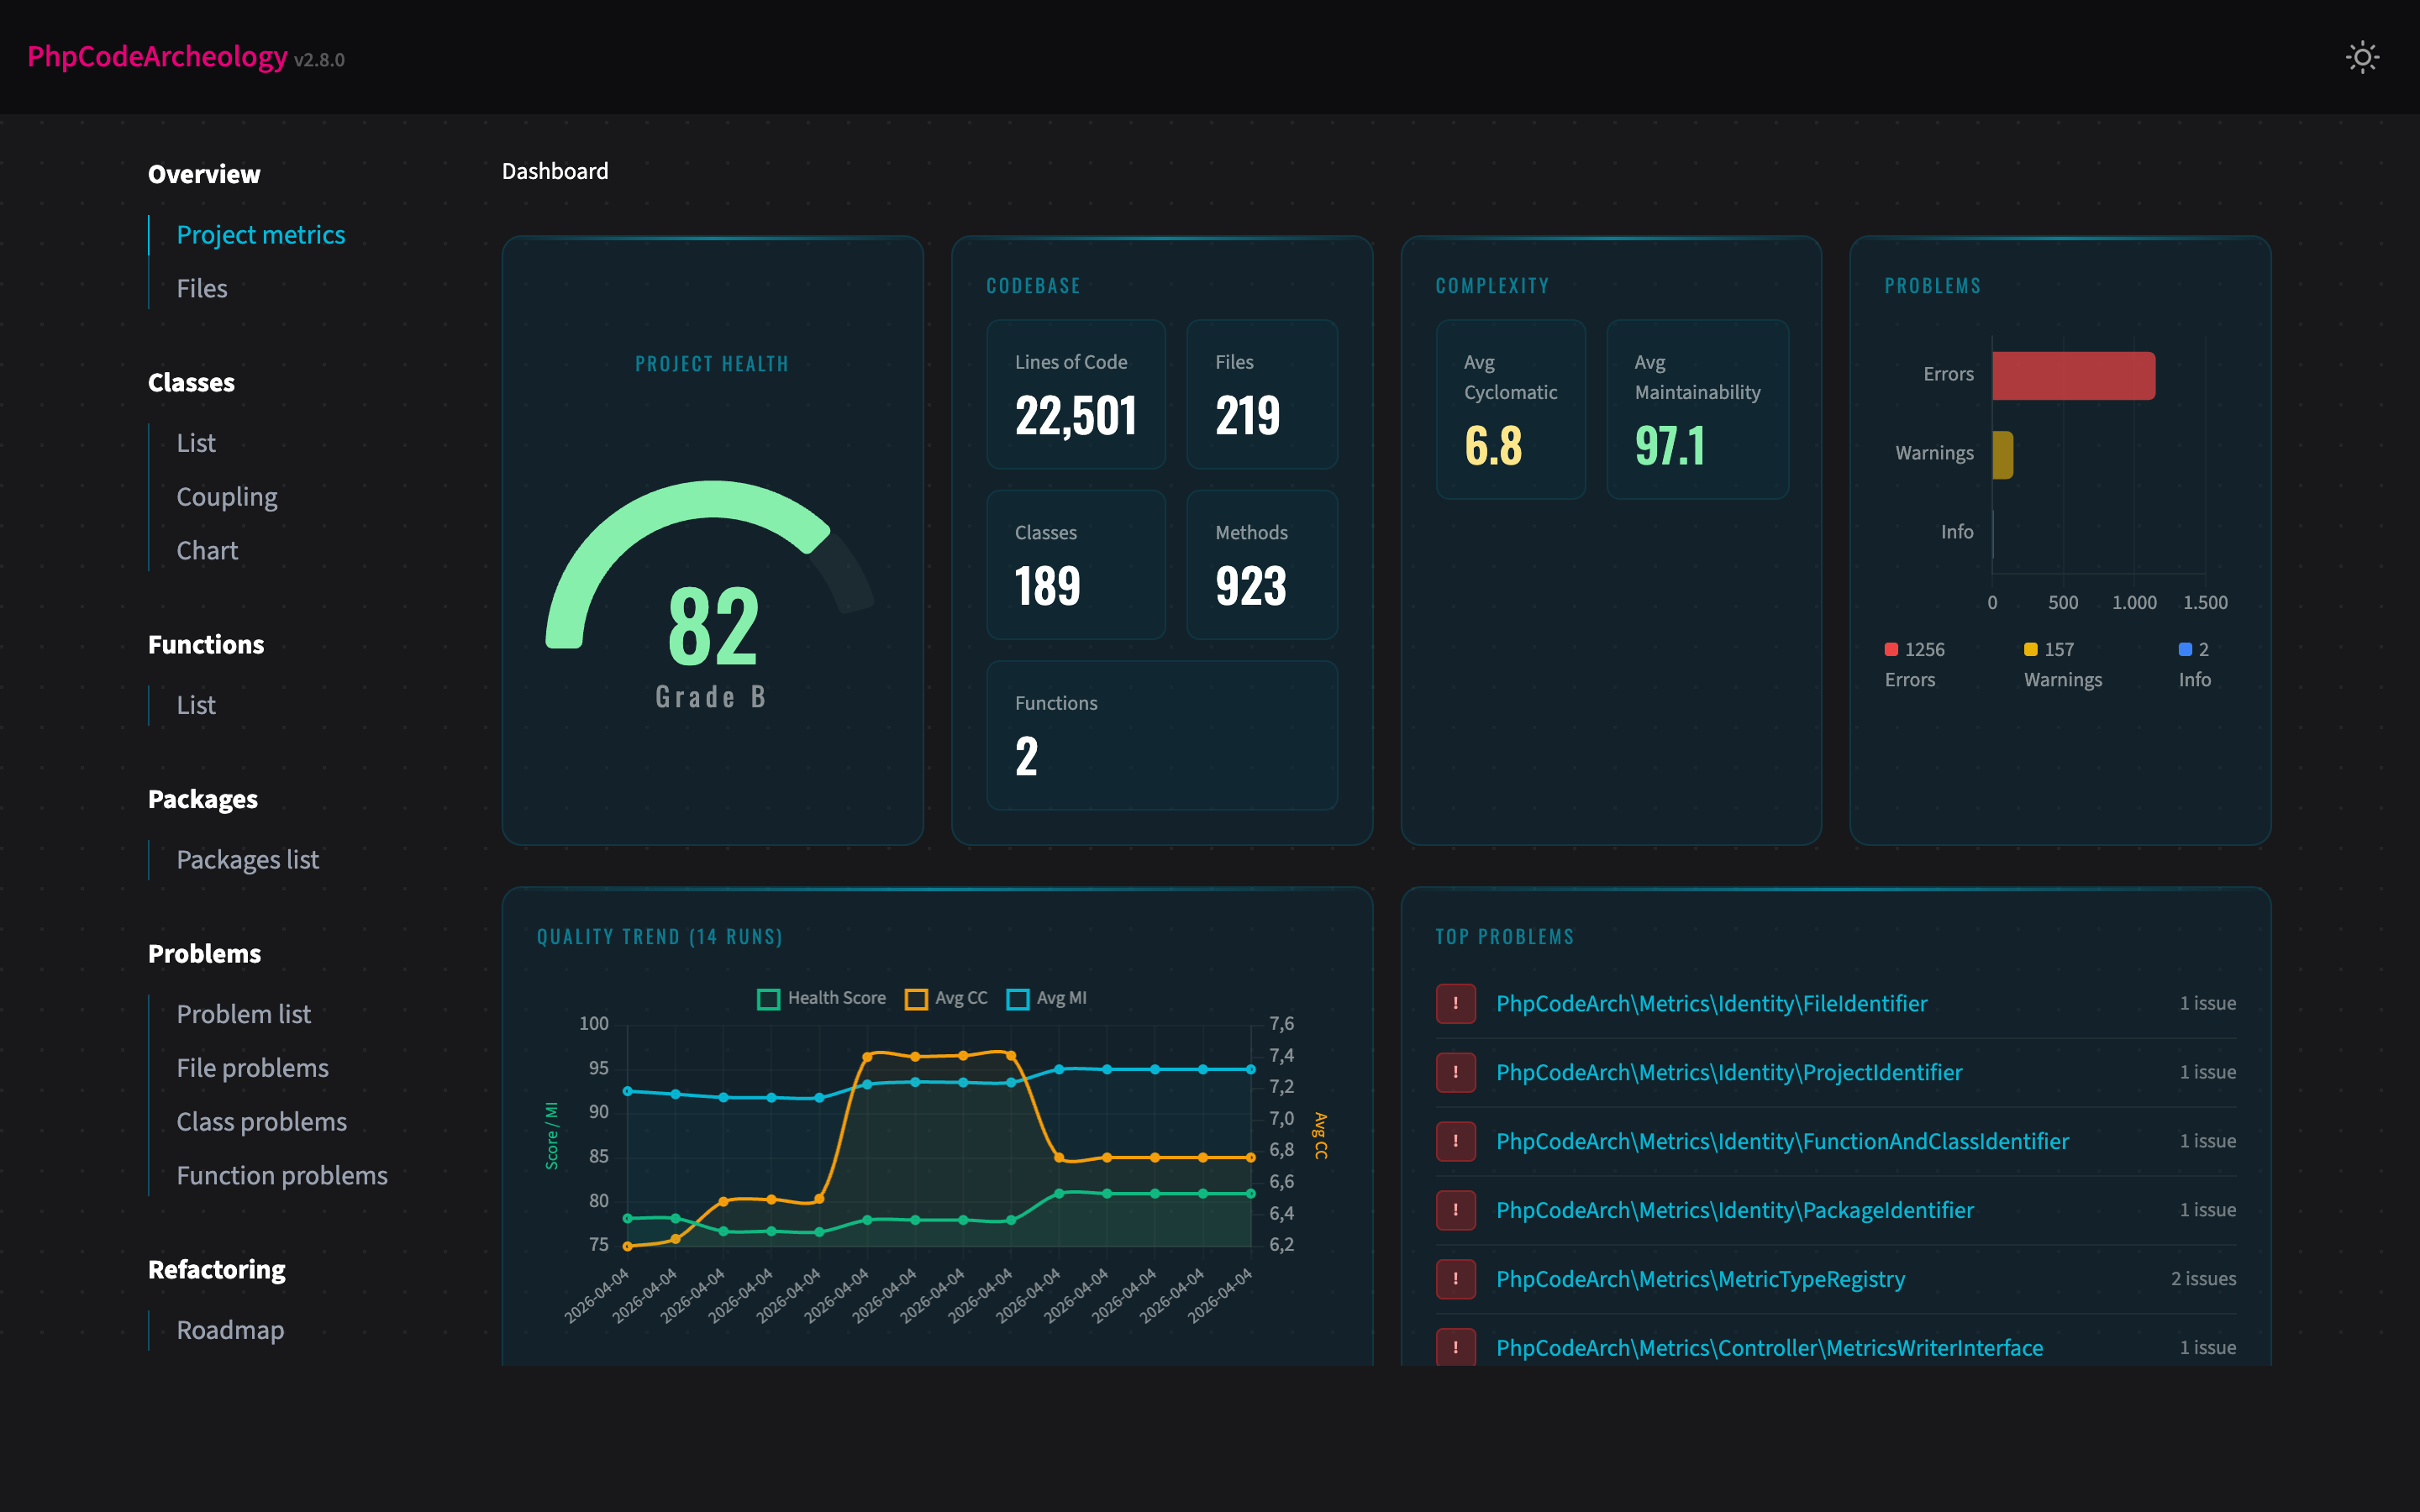
Features
- 60+ code quality metrics per file, class, and function — cyclomatic complexity, cognitive complexity, maintainability index, LCOM, Halstead metrics, coupling, instability, and more
- Problem detection with 14 built-in rules — God Class, too complex, dead code, security smells, SOLID violations, deep inheritance, low type coverage, untested complex code
- Test analysis — auto-detects PHPUnit/Pest/Codeception, maps test files to production classes, integrates Clover XML for line-level coverage, highlights untested hotspots
- Git integration — churn analysis, hotspot detection (high churn + high complexity), author tracking
- Source code display — view method source code directly in the HTML report with PHP syntax highlighting and a nesting-depth heatmap that reveals complexity hotspots at a glance (details below)
- Multiple report formats — interactive HTML, Markdown, JSON, SARIF (GitHub Code Scanning), AI summary, Knowledge Graph (JSON)
- Health Score — single 0-100 score with A-F grading for your entire project
- Technical Debt Score — weighted problem score normalised per 100 logical lines of code
- History tracking — trend charts across multiple analysis runs
- Baseline management — track only new problems, ignore existing ones (ideal for legacy projects)
- CI/CD ready — configurable exit codes, SARIF for GitHub Code Scanning, JSON for custom tooling
- Quick mode — fast terminal-only output without report generation
- CLAUDE.md generation — auto-generated project overview for AI coding assistants
- AI integration — native MCP server for AI assistants like Claude Code (details below)
Quick Start
No config file needed — the tool works out of the box. It scans your src directory and creates an HTML report in tmp/report. Open tmp/report/index.html in your browser.
Tip: Add
tmp/reportto your.gitignoreto keep generated reports out of version control.
Table of Contents
- Prerequisites
- Installation
- Using the Composer Plugin
- CLI Options
- Subcommands
- Configuration
- Test Analysis
- Report Types
- Source Code Display
- Knowledge Graph Export
- Key Metrics
- AI Integration (MCP Server)
- Understanding the Health Score
- Memory and Performance
- A Note on Metric Accuracy (v2.7.0)
- Development
- Roadmap
- Contributing
Prerequisites
- PHP 8.2 or higher (works on 8.2, 8.3, 8.4, 8.5)
- Composer
Installation
Global Installation
Make sure ~/.composer/vendor/bin (or ~/.config/composer/vendor/bin) is in your $PATH. Then run from any directory:
Docker
Run against a local project:
This mounts your project into the container and writes the HTML report to ./report/.
PHAR (for legacy codebases)
If your project has dependency conflicts with PhpCodeArcheology's requirements (e.g. an older nikic/php-parser version), download the standalone PHAR from the Releases page. The PHAR ships all dependencies bundled, so it works without touching your project's composer.json.
Use the PHAR when: your project's dependencies collide with PhpCodeArcheology's, you want a CI step without a composer require --dev, or you analyse a legacy codebase where adding dev-deps is risky.
Using the Composer Plugin
PhpCodeArcheology registers itself as a Composer plugin, so you can run the analysis directly via Composer:
When no path is given and no config file exists, it automatically detects your PSR-4 source directories from composer.json. All CLI options are supported:
To create a config file interactively:
CLI Options
| Option | Description |
|---|---|
--report-type=TYPE | Report format: html (default), markdown, json, sarif, ai-summary, graph. Comma-separated for multiple: html,json |
--report-dir=DIR | Output directory (default: tmp/report) |
--quick | Fast analysis with terminal output only, no report generation |
--no-color | Disable coloured terminal output (also respects NO_COLOR env) |
--fail-on=LEVEL | Exit 1 on error or warning (for CI pipelines) |
--generate-claude-md | Generate a CLAUDE.md project overview |
--git-root=DIR | Git repository root (default: current directory) |
--extensions=EXT | File extensions to analyse (comma-separated, default: php) |
--exclude=DIR | Directories to exclude (comma-separated) |
--coverage-file=FILE | Clover XML coverage file from PHPUnit/Pest for line-level coverage data |
--source-code | Include source code with syntax highlighting and nesting heatmap in the HTML report (details below) |
--version | Show version |
Subcommands
init — Create Config File
Interactively creates a php-codearch-config.yaml with sensible defaults. Detects common source directories (src, app, lib) automatically.
compare — Compare Two Reports
Shows a delta view of metrics, problem counts, and lists new/resolved problems. Useful for answering: "Did my refactoring actually help?"
baseline — Track New Problems Only
create saves the current problem set as a baseline. check runs a fresh analysis and reports only problems that are new compared to the baseline. Returns exit code 1 if new errors are found — ideal for CI pipelines on legacy projects.
Configuration
Create a php-codearch-config.yaml in your project root (or use init):
Note: Enums, interfaces, traits, and classes with 0-1 methods are always excluded from LCOM warnings regardless of configuration.
All threshold values shown above are the defaults. You only need to specify values you want to override.
Test Analysis
PhpCodeArcheology automatically detects your test infrastructure from composer.json (PHPUnit, Pest, or Codeception) and maps test files to production classes using PSR-4 namespaces, naming conventions, and directory structure.
What you get out of the box:
- Per-class
hasTestflag and test file count in the HTML/Markdown/JSON reports UntestedComplexCodewarnings for classes with cyclomatic complexity ≥ 8 and no tests (only when test infrastructure is detected)untestedas a refactoring priority driver- A Tests page in the HTML and Markdown reports with a coverage gaps table and dashboard tiles
Important note on Pest: Pest's function-based tests (it(...), test(...)) contain no class declaration and cannot be mapped to production classes by name alone. To get accurate coverage for Pest projects, generate a Clover XML report — this tracks actual line execution regardless of test style.
With Clover XML coverage data (optional, recommended for Pest), you get line-level coverage per class:
To make the path persistent across runs, set it in your config file:
The CLI flag still takes precedence over the config file value.
Coverage data is factored into the Health Score as a 10th factor (10% weight). The get_test_coverage MCP tool exposes all coverage data to AI assistants.
Report Types
| Type | Subdirectory | Output | Use Case |
|---|---|---|---|
html | html/ | Interactive HTML report with charts | Browser-based review |
markdown | markdown/ | Markdown files | Text-based review, Git-friendly |
json | json/ | report.json | Machine processing, custom tooling |
sarif | sarif/ | report.sarif.json | GitHub Code Scanning, VS Code SARIF Viewer |
ai-summary | ai-summary/ | ai-summary.md | Token-efficient summary for LLM consumption |
graph | graph/ | graph.json | Knowledge Graph (nodes + edges) for AI tools and visualisations |
Since v1.6.0, each report type writes into its own subdirectory. history.jsonl remains in the report root.
Generate multiple report types in one run:
Upgrading from v1.5.x? Old report files in the report root (e.g.
index.html,report.json) are no longer overwritten. They can be safely deleted.
Source Code Display
The HTML report can embed the actual source code of methods and functions — with PHP syntax highlighting and a nesting-depth heatmap that makes complexity visible at a glance.
What you see:
- Full PHP source code with syntax highlighting (powered by highlight.js)
- Nesting heatmap — lines inside deeper control structures (if/for/while/switch/catch) progressively light up from yellow to red, so the complexity drivers are immediately obvious
- Problem badges above the code showing all detected issues (e.g. "Complexity is too high")
- Severity border — the code block gets a colored left border matching the worst problem level
Configuration:
problems-only(default with--source-code) — only shows source for methods with detected problems, keeping the report size manageableall— shows source for every method and function
The highlight.js assets are only included in the report when the feature is enabled.
Knowledge Graph Export
The graph report type exports your codebase structure as a machine-readable Knowledge Graph — designed for AI tools, graph databases, and custom visualisations.
The JSON output contains four top-level arrays:
nodes — five types of nodes, each with an id, type, name, metrics, and flags:
| Node type | Metrics |
|---|---|
class | cc, lcom, mi, instability, afferentCoupling, efferentCoupling, gitChurnCount, gitCodeAgeDays |
method | cc, cognitiveComplexity, params |
function | cc, cognitiveComplexity, params |
package | abstractness, instability, distanceFromMainline |
author | commitCount, filesChanged |
edges — relationships between nodes:
| Edge type | Meaning |
|---|---|
declares | Class → Method |
extends | Class → Parent class |
implements | Class → Interface |
uses_trait | Class → Trait |
depends_on | Class → Class (via new / static call) |
calls | Method → Method (cross-class calls via new / static call, weight = call-site count) |
belongs_to | Class → Package |
authored_by | Class → Author |
cycle_member | Class ↔ Class (dependency cycle, bidirectional) |
clusters — classes grouped by package.
cycles — detected dependency cycles with the involved class node IDs.
Key Metrics
| Metric | Description |
|---|---|
| Cyclomatic Complexity (CC) | Number of independent paths through code. Below 5 is good, above 10 needs attention. |
| Cognitive Complexity | How difficult code is to understand (considers nesting depth). |
| Maintainability Index (MI) | Composite score from CC, Halstead volume, and LOC. Above 85 is good, below 65 is concerning. |
| LCOM | Lack of Cohesion of Methods — how well a class's methods relate to each other. Lower is better. |
| Halstead Metrics | Difficulty, effort, volume, and vocabulary based on operators/operands. |
| Type Coverage | Percentage of parameters and return values with type declarations. |
| Instability | Ratio of efferent to total coupling (0 = stable, 1 = unstable). |
| Technical Debt Score | Weighted problem points per 100 logical lines of code. |
| Health Score | Overall project quality grade from A (excellent) to F (critical). |
For detailed descriptions, formulas, thresholds, and interpretation guidelines, see the Metric Reference.
The HTML report also includes a full Metric Glossary with descriptions, thresholds, and severity levels.
AI Integration (MCP Server)
PhpCodeArcheology includes a native MCP (Model Context Protocol) server — AI assistants like Claude can query your codebase analysis results directly, without reading files or parsing JSON manually.
Setup with Claude Code
The setup depends on how you installed PhpCodeArcheology:
Global installation (composer global require php-code-archeology/php-code-archeology):
Project dependency (composer require --dev php-code-archeology/php-code-archeology):
Or drop a .mcp.json into your project root for team sharing:
Once connected, Claude can answer questions like "Which classes have the highest technical debt?", "Show me all God Classes", or "What are the top refactoring priorities in this project?" — using live analysis data.
Available MCP Tools
| Tool | Description |
|---|---|
get_health_score | Overall code health score, grade, and project statistics |
get_problems | Code quality problems, filterable by severity and type |
get_metrics | Detailed metrics for a specific class, file, or function |
get_hotspots | Git hotspots ranked by churn × complexity |
get_refactoring_priorities | Ranked refactoring candidates with recommendations |
get_dependencies | Class dependency analysis (incoming/outgoing) |
get_class_list | All classes with key metrics, sortable and filterable |
get_graph | Knowledge graph as JSON (nodes, edges, cycles) |
get_impact_analysis | Impact analysis: what breaks if you change a method? Shows callers and call chains |
get_test_coverage | Test coverage summary — tested/untested classes, coverage gaps, test mapping |
search_code | Search entities by name with metric overview |
Understanding the Health Score
The Health Score (0–100) is a guideline for tracking trends, not an absolute judgment of code quality. Some things to keep in mind:
- Complex domains produce complex code. A financial calculation engine, a protocol parser, or a compiler will naturally have higher Halstead Difficulty and Cyclomatic Complexity than a REST API. That's expected, not a defect.
- Scores are most useful over time. A project that moves from 65 to 72 over six months is improving — even if it never reaches 90.
- Focus on outliers, not the average. The most actionable insight is which classes deviate significantly from your project's baseline. Those are your refactoring candidates.
- Don't compare across projects. A score of 80 in a Symfony application is not the same as 80 in a CLI tool. Different architectures and domains have different natural complexity floors.
The score is weighted across 10 factors (Maintainability Index, Problem Density, Complexity, Coupling, Code Structure, HTML Ratio, Encapsulation, Dependencies, Abstractness, and Test Coverage). See docs/metrics-formulas.md for the exact formulas and weights.
Further reading: How I Use PhpCodeArcheology in Practice — a real-world walkthrough covering legacy assessment, hotspot discovery, and measuring refactoring success.
Memory and Performance
The directories vendor/, node_modules/, and .git/ are excluded automatically — you don't need to configure this. If you point the tool at your project root, only your own code is analysed.
For large codebases (50k+ files), analysis may require more memory than the default 1G. The tool respects your php.ini memory_limit — if you've set it to -1 (unlimited), it stays unlimited. To adjust the limit per project, add memoryLimit to your config file:
A Note on Metric Accuracy (v2.7.0)
I use PhpCodeArcheology extensively on my own projects to track code quality over time. While doing so, I noticed that some metric values didn't quite add up — method-level Halstead difficulty seemed too high, certain classes were flagged as God Classes when they shouldn't have been, and error counts felt inflated.
After a thorough review, I found and fixed several calculation bugs that had been present since earlier versions. The most impactful was a Halstead operand tracking bug at the method level, along with double-counting in complexity predictions, false positives in God Class detection, and a few other issues.
I sincerely apologize for the inaccuracy. A code analysis tool must be trustworthy above all else, and these bugs undermined that. Version 2.7.0 corrects all known calculation issues, and I've added hand-calculated test fixtures to ensure the formulas stay correct going forward.
What this means for you: If you're upgrading from an earlier version, your analysis results will change — most notably, error counts will decrease significantly and Health Scores will improve. The tool will show a one-time notice on first run. See docs/metrics-formulas.md for a detailed breakdown of every change and its expected impact.
Development
The HTML report templates use Tailwind CSS. The compiled output.css is committed to the repository, so you do not need Node.js to use or contribute to this project.
If you modify HTML templates or CSS, rebuild with:
For live rebuilding during development:
Roadmap
See ROADMAP.md for planned features. The next major version (3.0) is in development on the 3.0.x branch — it reworks how relative problem thresholds are calculated, replacing the current "percentage above/below project average" rule with robust statistical outlier detection. Track progress in the 3.0.0 milestone.
Contributing
Contributions are welcome! Check the open issues for bugs and feature requests, or see the Roadmap for planned features. For larger changes, open an issue first to discuss the approach.
Author
Marcus Kober — GitHub
License
MIT