Hono Telescope README
The full upstream README, mirrored here for reference. Install config, tool schemas, adoption signals, and an original overview live on the Hono Telescope listing page.
hono-telescope









A debugging tool for Hono applications, inspired by Laravel Telescope: a dashboard that shows you every request with the logs, queries, exceptions and outgoing calls that happened inside it.
The same endpoint is also an MCP server. Point Claude Code, Cursor or any MCP client at it and your coding agent reads the running application's telemetry directly — the actual exception, the request that produced it, and the queries that ran — instead of being handed a pasted stack trace. Nothing else in the Hono ecosystem does that.
Zero runtime dependencies. Works on Node.js and Bun.
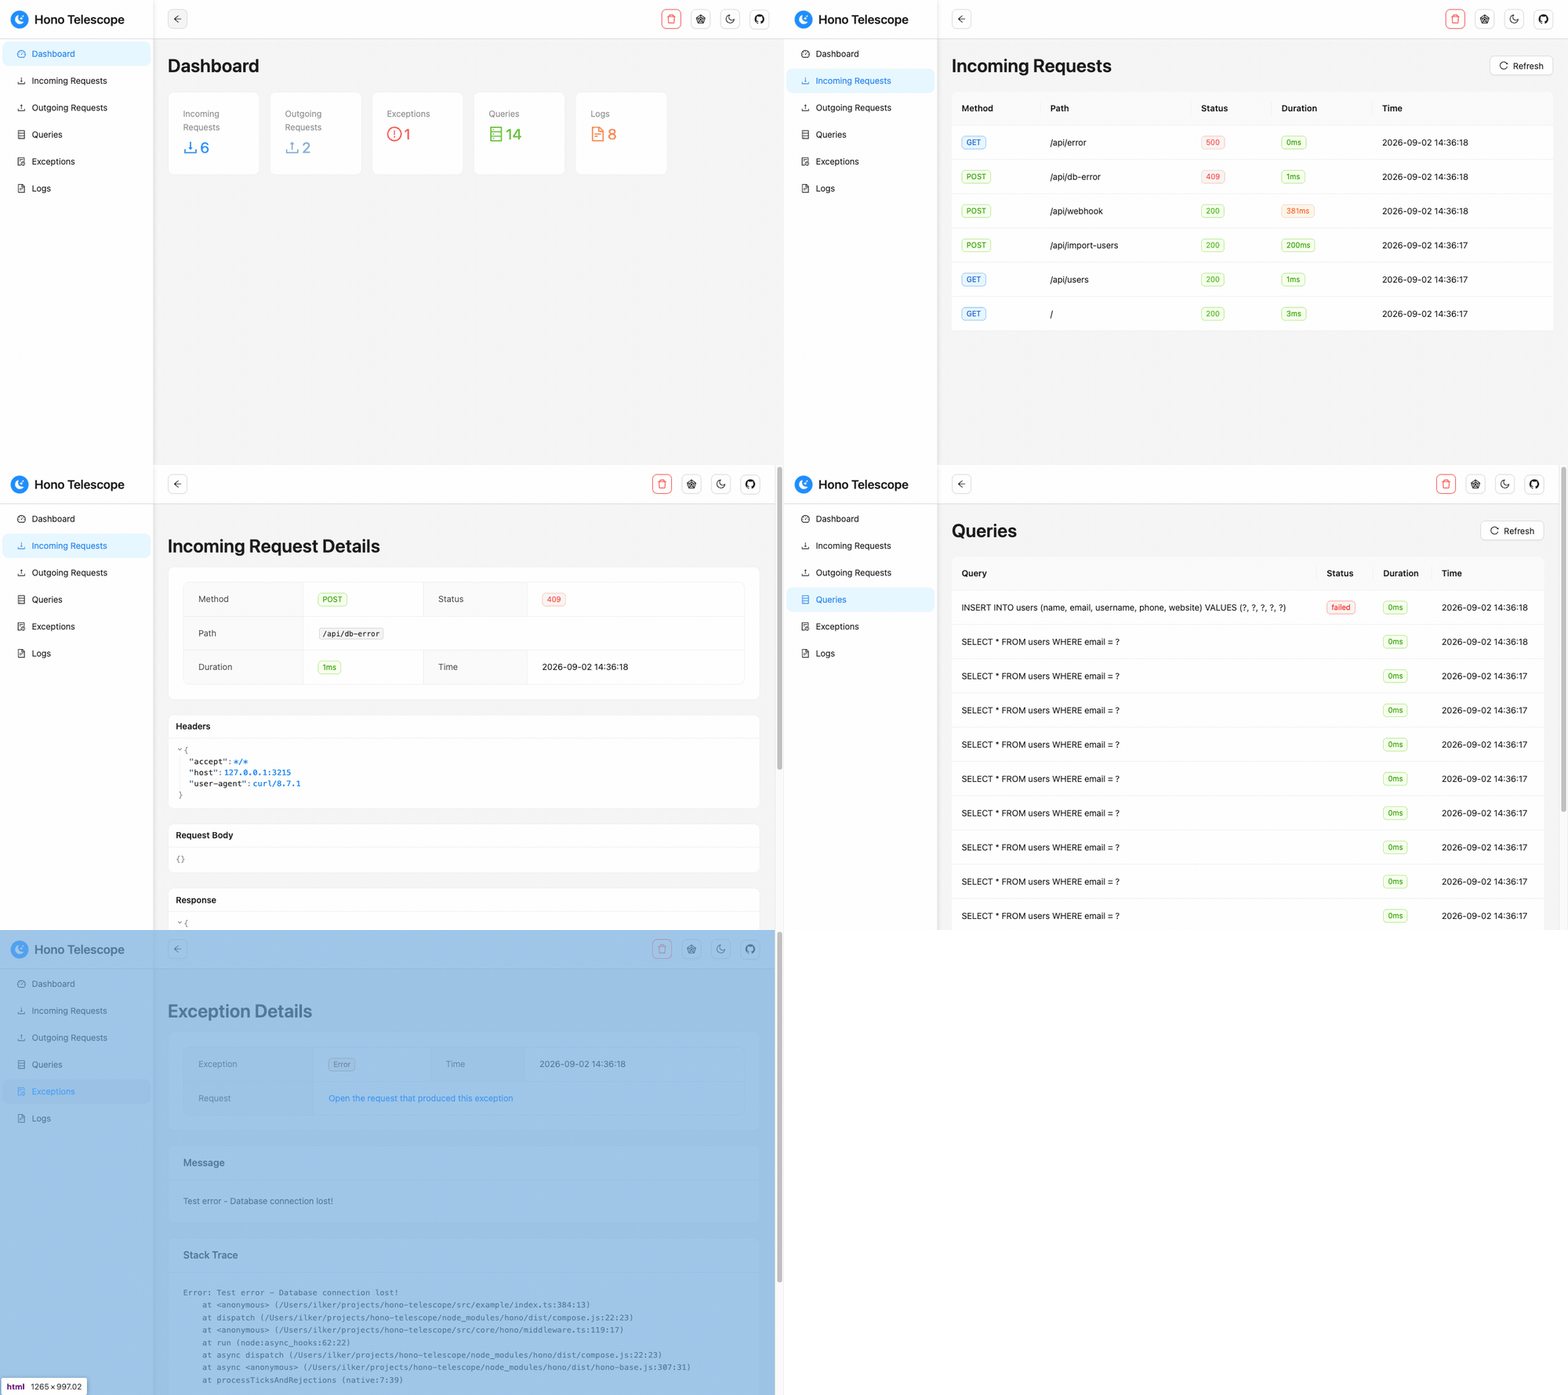
🌐 Live Demo
A hosted instance of the example app, running 1.0. No installation needed.
📊 Open the dashboard — API base: https://hono-telescope.ilkerbalcilar.com
Hit a few endpoints and watch the entries appear:
The demo runs with memoryStorage({ maxEntries: 500 }) and no dashboard auth, so entries are
public, capped at 500 and gone on restart. Don't send anything you wouldn't publish.
✨ Features
Currently Available:
- 📡 MCP Server - The dashboard endpoint doubles as a Model Context Protocol server, so an AI agent can read live requests, exceptions and queries with five read-only tools
- 🔍 HTTP Request Monitoring - Track incoming requests with headers, payloads and response bodies, and outgoing
fetchcalls with headers, payloads and responses - 🚨 Exception Tracking - Capture and monitor application errors with stack traces
- 📝 Log Monitoring - Monitor console logs with different severity levels
- 🗄️ Database Query Monitoring - Explicit per-client instrumentation for Prisma, Sequelize, MongoDB, and Bun SQLite with execution time
- 📊 Beautiful Dashboard - Modern React-based web interface with real-time updates
- 🎯 Zero Configuration - Works out of the box with sensible defaults
- 🏷️ Tagging System - Organize entries with custom tags and context
- 🔧 TypeScript Support - Full type definitions and type safety
- ⚡ High Performance - Minimal overhead with efficient memory management
- 🌐 Bun & Node.js - Works with both runtimes seamlessly
- 🗂️ Multiple Database Support - Integrates with popular database libraries
- ⚙️ Zero Runtime Dependencies - Depends only on Hono (peer dependency)
Planned Features (Roadmap):
- 💾 Data Export - Export monitored data in multiple formats (JSON, CSV)
- 🔔 Alerts & Notifications - Real-time alerts for errors and performance issues
- 📈 Analytics & Reporting - Advanced analytics and historical data analysis
- 🔐 Authentication & Authorization - Dashboard access control beyond basic auth
- 🌍 Multi-Tenancy Support - Support for multiple isolated projects
- 🧩 Plugin System - Extensible plugin architecture for custom integrations
- 🔄 Data Persistence - Optional database storage for long-term monitoring
📦 Installation
Quick Start
Visit /telescope. Telescope is on by default outside production and off inside it.
📋 Complete Example: See src/example/index.ts for a full working example with all Telescope features including database query monitoring, external request tracking, and error handling.
MCP Server
Telescope's dashboard doubles as an MCP server, so an AI coding agent can read the running application's telemetry instead of being handed pasted stack traces. There is nothing extra to mount — it is served from the dashboard you already mounted:
| Tool | What it answers |
|---|---|
recent_exceptions | What just failed — each exception with its request and that request's logs and queries |
recent_requests | Which requests ran; filter by minStatus, status, minDuration, uriContains |
request_detail | One request in full, untruncated, with every child entry |
slow_queries | The slowest recent queries and which request each ran in |
stats | How many entries of each type exist |
All five are read-only; there is no tool that clears or writes telemetry. minStatus: 400 is
the one worth remembering — a handler that returns an error status without throwing records no
exception, so that filter is the only way to find those failures.
The transport is the current Streamable HTTP revision (2026-07-28), with 2025-11-25 still
accepted for older clients. GET and DELETE answer 405: this revision has no SSE stream
and no sessions.
Clients that only speak stdio
Many editors cannot point an MCP client at a URL. The package ships a bridge for them: it reads one JSON-RPC message per line on stdin, forwards it to the endpoint your app already serves, and writes the reply back on stdout.
--url (or TELESCOPE_URL) is the only required option. For a dashboard behind
dashboard.auth, pass credentials as a header — --header is repeatable, and
TELESCOPE_HEADER takes one for clients that can only set environment variables:
The bridge forwards; it does not implement the protocol a second time. Your app stays the only place that answers MCP, so the bridge adds no tools, no session state and no new dependency — and it needs the app to already be running.
The MCP endpoint exposes exactly what the dashboard exposes — request and response bodies, headers and SQL — to whatever agent you connect. It is covered by
dashboard.authand by the same production refusal: withenabled: trueunderNODE_ENV=production, mounting without credentials throws.
Configuration
All options are optional — createTelescope() works with the defaults.
| Key | Type | Default | Notes |
|---|---|---|---|
enabled | boolean | NODE_ENV !== 'production' | Disable in production by default |
storage | StorageAdapter | memoryStorage({ maxEntries: 1000 }) | In-memory storage with 1000 entry limit |
context | ContextStrategy | alsContext() | AsyncLocalStorage-based request context tracking |
collectors | Collector[] | [consoleCollector(), exceptionCollector(), fetchCollector()] | Default collectors for console, exceptions, and fetch; pass [] to disable all |
dashboardPath | string | '/telescope' | Dashboard mount path; must match the path in app.route() |
ignorePaths | string[] | ['.well-known'] | Paths to exclude from monitoring |
ignoreStaticAssets | boolean | true | Skip monitoring requests for static files (.js, .css, .svg, etc.) |
capture.requestBody | boolean | true | Capture incoming request bodies |
capture.responseBody | boolean | true | Capture outgoing response bodies |
capture.maxBodySize | number | 65536 | Maximum bytes to capture per body (64 KB) |
redact.headers | string[] | ['authorization', 'cookie', 'set-cookie', 'x-api-key', 'proxy-authorization'] | Header names to redact |
redact.bodyKeys | string[] | ['password', 'token', 'secret', 'apikey', 'authorization'] | Object keys to redact in request/response bodies |
dashboard.auth | DashboardAuth | false | undefined | Optional basic auth for dashboard; required if enabled: true in production |
Mounting at a Custom Path
If you mount the dashboard at a path other than /telescope, you must set dashboardPath to the same value:
The middleware uses dashboardPath to avoid recording the dashboard's own traffic, and the dashboard uses it to construct its base URL.
Database Queries
Pass your database client to Telescope for query instrumentation. Prisma returns a new client—use the returned one:
Supported databases:
Note: Automatic database interception was removed in 1.0 because it never worked under Node ESM and captured only raw SQL where it did run. Explicit per-client instrumentation is now required.
A query that fails is recorded too, marked failed with the client's own error message, so a
failed command is distinguishable from a slow one in the dashboard and over MCP. This covers
Prisma, MongoDB and Bun SQLite. Sequelize is the exception: it is instrumented through the
afterQuery hook, which does not appear to run when a query fails, so failed Sequelize queries
are currently not recorded at all. Fixing that needs verification against a real Sequelize.
Call each instrument* method once per client. Unlike the collectors, they are not
idempotent (only instrumentBunSqlite guards against double wrapping), so instrumenting the
same client twice records every query twice.
instrumentBunSqlite wraps the query and prepare statement factories, so statement calls
(all, get, run, values) are recorded. Queries issued directly on the database —
db.exec, db.run, db.all, db.get — are not captured.
Security
The dashboard exposes request and response bodies, headers, and SQL. Telescope is therefore disabled when NODE_ENV === 'production'. If you enable it there anyway, you must supply dashboard.auth; mounting without it throws.
You have two options for production:
- Supply credentials to protect the dashboard with basic auth:
- Explicitly opt out of auth to acknowledge full exposure (no auth, dashboard fully open):
Sensitive headers (authorization, cookie, set-cookie, x-api-key, proxy-authorization) and body keys (password, token, secret, apikey, authorization) are redacted by default, at any nesting depth. Redaction is recursive through nested objects and arrays, case-insensitive, and replaces values with [REDACTED] rather than deleting them.
Limitations
- Outgoing request bodies are captured only when they are already in memory — a string,
a
URLSearchParamsor anArrayBuffer. AReadableStream,FormDataorBlobbody, and the body of aRequestobject passed as the first argument tofetch, are skipped and the payload stays empty. Reading those would either consume the body the caller is about to send or force aclone()that can stall on Node. - Streamed responses are not captured. Responses produced by Hono's
streamTextandstreamSSEare recorded without a body, so that recording never buffers or delays a stream. Detection relies on theTransfer-Encoding: chunkedheader those helpers set (the barestream()helper sets no content-type, so it is skipped too); a hand-rollednew Response(readableStream, { headers: { 'content-type': 'text/plain' } })sets neither header, so it is read and buffered before being recorded. SetTransfer-Encoding: chunkedor a non-text content type on such a response to opt it out of capture. - Request and response bodies larger than
capture.maxBodySizeare recorded as metadata only ({ truncated: true, size }), and a non-JSONtext/*request body is recorded as{ body: text }. A JSON array body is wrapped so that a recorded body is always an object:{ body: [...] }for requests,{ response: [...] }for responses. Redaction still reaches inside the array.
Custom Storage Adapters
Implement StorageAdapter and verify it against the contract suite that ships with the
package:
The suite (a Vitest suite; run it with your own test runner installed) pins the two ordering
guarantees the dashboard relies on: list returns newest first, and findByParent returns
oldest first.
Upgrading from 0.x
The 1.0 release introduces a new API centered on createTelescope():
0.x (Old API)
1.0 (New API)
Key changes:
setupTelescope(app, config)is replaced bycreateTelescope(config)with explicit middleware and dashboard mounting- Configuration keys are now camelCase (e.g.,
max_entries→maxEntries,sanitize_headers→redact.headers) - Database interception is now explicit per-client; automatic interception was removed
- Axios interception was removed (axios on Node does not use
fetch) - A request whose handler throws is recorded with the status your own
onErrorreturned, and the exception is recorded as a child entry of that request
Development
Getting Started
First, install dependencies:
Then build the project for the first time:
Running in Development Mode
Start the TypeScript watcher and example app:
Terminal 1 - TypeScript Compilation (Watch Mode)
This watches for TypeScript changes and compiles them to JavaScript.
Terminal 2 - Example Application
This starts the example Hono application with hot reload at http://localhost:3000
- Example API endpoints:
http://localhost:3000/api/... - Dashboard:
http://localhost:3000/telescope
Test all endpoints at once with the test script:
This will automatically test all endpoints and populate the dashboard with data.