A lightweight Java IDE for AI agents: incremental builds, fast tests, HotSwap and live debugging.
Quick Install
Automated & IDE SetupCopy the AI prompt to install this server into Claude Code, Cursor, or another agent — or use 1-click editor setup below.
One-click editor setup isn’t available for this listing yet — we don’t have a confirmed install command, and we’d rather show nothing than point your editor at the wrong package or host. Follow the project’s own setup instructions, linked above.
Manual Client & Custom JSON ConfigExpand JSON ▾
No confirmed setup config for this listing yet. We only publish a config block when the install details come from the project itself — its README, its docs, or a verified owner. We haven’t found those for joLink, and we’d rather show nothing than a guess you’d paste into your client. Follow the project’s own setup instructions for the current steps.
Documentation Overview
joLink Runtime
English | 简体中文
A lightweight, headless Java IDE for AI coding agents.
Closing the loop for autonomous Java development.
Design principle: Everything exists to reduce uncertainty for the LLM.
joLink does not provide an editor UI. Instead, it exposes incremental compilation, testing, application startup and breakpoint debugging through MCP to the coding agent you already use—so it can run the code, inspect real state, and verify its own changes.
Persistent compilation state and HotSwap reduce repeated full rebuilds and JVM restarts. When tests, logs and endpoint responses are not enough, the agent can use breakpoints and inspect exception events, stack frames and variables.
Free and local. It does not require a joLink account, model API key, inference provider, or separate agent application.
Install
- Open a new chat in your coding agent.
- Click the copy button in the code block below, paste the entire prompt into that chat, and send it.
- If the agent reports that a reload is needed, reconnect MCP or restart the client as instructed, then open a new chat. Configuration complete but not yet loaded is not an installation failure. In the loaded chat, you can send:
The guide provides official client-specific locations and examples for Codex,
Claude Code, Cursor, VS Code/Copilot, CodeBuddy, Gemini CLI, OpenCode, Cline,
Roo Code, Windsurf and Kiro. All start MCP with uvx jolink-runtime@latest and use the same
English Skill; no plugin bundle or universal installer
is required. MCP performs the work; the Skill explains the workflows; the optional
global verification rule makes proportionate
Java verification part of implementation tasks across projects. The prompt above
explicitly enables it; remove that line if you only want MCP and the Skill.
The guide also covers uv setup, preserving configuration, reconnection and verification.
For Chinese instructions, use the Chinese installation guide.
Why joLink
Coding agents are good at reading and changing code, but they can become stuck in a loop of static assumptions:
joLink adds the missing runtime feedback loop:
This is useful when:
- the Java application is not running yet;
- a code change needs to be verified against real behavior;
- repeated patches have not solved the problem;
- endpoint results do not match the source-code interpretation;
- logs or tests are insufficient to explain the executed path;
- business naming is inconsistent and static search cannot find the relevant code;
- deeper runtime evidence such as breakpoints, stacks, or variables is needed.
The goal is not to use a debugger for every problem.
Start with the cheapest useful evidence:
Debug deeper only when necessary.
What it can do
joLink exposes four focused MCP tools:
java_application— project launch, compile-aware restart (HotSwap by default), stop, and attach;java_fast_test— selected Java tests, result details and cancellation, without an application launch;java_status— Java process discovery, compact status, on-demand details and logs;java_debugger— breakpoints, exception events, stacks, variables, and resume.
After editing a managed project, call java_application(action=restart).
It incrementally compiles changes in the existing JDT workspace and prefers
HotSwap; incompatible changes restart the JVM using those same compiled outputs.
Set hotswap=false to force process/application reinitialization. The result's
apply_method distinguishes HotSwap from a real restart. See
restart workflow.
Fast Test uses a Maven or Gradle Probe only when its small configuration cache is absent or changed. The exported test Build World and JDT workspace persist across MCP processes. JDT keeps main and test classes current and runs explicit JUnit 4/5 or TestNG tests in an isolated JVM:
java_status(status).fast_test stays compact. If compilation fails before run
returns, its reply includes compiler diagnostics directly. Errors that occur after
a timeout reply and failed-test details are available through result; follow
the summary's next_action or use its test_run_id, without rerunning tests.
Full compiler file lists are omitted. Only the active
and most recently completed test attempts are retained in the current MCP session;
an unavailable ID returns TEST_RUN_NOT_FOUND.
passed=false means the selected tests executed and found a failure; it is not
a Tool infrastructure error. Fast Test does not require or modify a running
application. The current JDT supports Java 8 through 26 source/target levels;
product regression covers 8, 11, 17 and 21, including separate main/test levels.
Target libraries and application/test JDKs still follow the project. Supported
build layouts include Maven jar projects, one
explicitly selected jar module in a standard Reactor, and Gradle Java builds
including multi-Project dependencies (tested with 7.4.2, 8.10 and 8.14).
Maven and Gradle multi-module launch and Fast Test resolve the selected
module's upstream dependencies into separate JDT projects in one Worker.
Unchanged modules reuse their output; JavaBuilder propagates changed APIs and
constants to affected downstream sources. Local module dependencies use current
workspace output rather than installed JARs; Maven also supports test-jar
dependencies. See Gradle multi-module flow and evidence.
Demo
From an unexpected API response to runtime investigation.
Reading source code tells an agent what might happen. Running the application and inspecting its state helps the agent check what actually happens.
The screenshots below show a debugging example: an agent starts a Java application, checks an endpoint, notices an unexpected result, and uses joLink to investigate the execution path.
This is a constructed demonstration scenario, not a record of an actual business incident. Some sensitive information in the screenshots has been redacted for privacy.
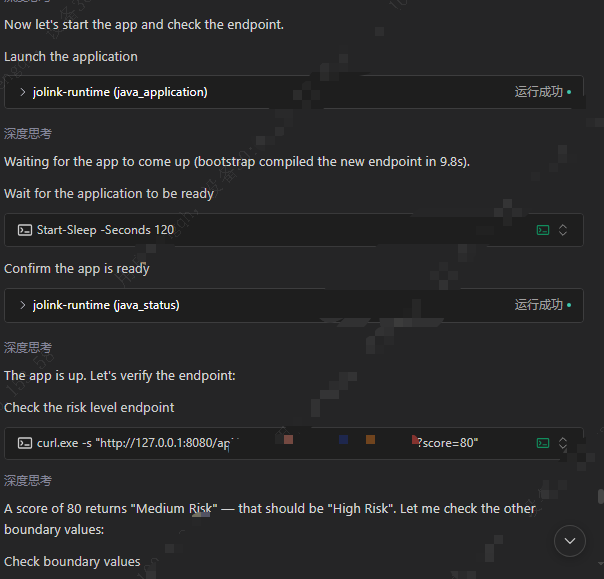
1. Start the application and check the actual response
The agent uses java_application to launch the application and java_status
to check its state, then sends an HTTP request to a sample risk-scoring endpoint.
For score=80, the expected category is High Risk, but the agent reports
Medium Risk. It checks additional boundary values before investigating further.
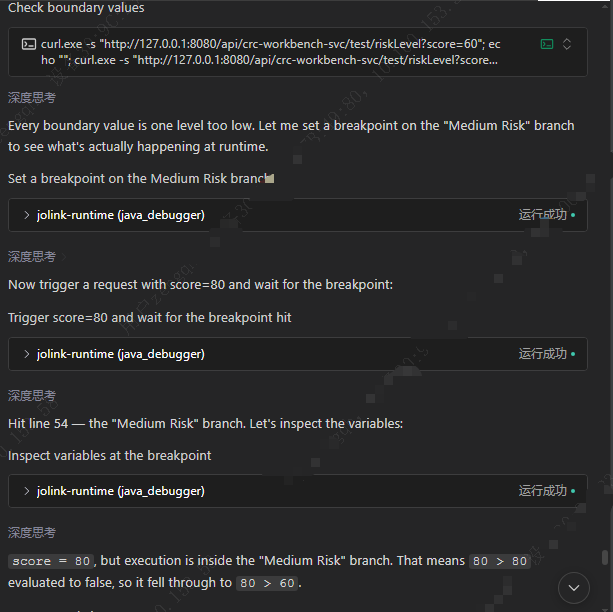
2. Set a breakpoint and inspect runtime variables
The agent uses java_debugger to set a breakpoint on the Medium Risk branch,
triggers another request, and inspects the variables after the breakpoint is hit.
The conversation shows score=80 while execution is in the Medium Risk
branch. This gives the agent runtime evidence to investigate its
boundary-condition hypothesis, rather than relying only on source-code assumptions.
This example demonstrates application startup and runtime investigation. It is not a Fast Test performance benchmark; the screenshots cover the investigation stage, not the subsequent fix and re-verification.
Private diagnostics
joLink keeps stdout exclusively for MCP JSON-RPC. Python lifecycle logs and tracebacks are also written to a bounded private rotating file:
status does not return mcp.log paths or logging configuration, even with details=true.
Read the local file at the path above when diagnosing joLink itself. A diagnostic-file
failure never prevents the MCP server from starting. The file is limited to
4 MiB with three rotated backups; stdout remains untouched.
Related MCP Servers
Reviews
No reviews yet — be the first to share how this listing worked for you.
Frequently Asked Questions about JoLink
AllMCPs Directory Badge
Showcase your server listing on GitHub or your project documentation. Embed this dynamic SVG badge to highlight official listing status and live engagement.
Badge Style:
Live Dynamic SVG Preview
Markdown (GitHub README)
[](https://allmcps.com/mcp/jolink)HTML Embed
<a href="https://allmcps.com/mcp/jolink"><img src="https://allmcps.com/api/badge/jolink?style=directory" alt="JoLink on AllMCPs" /></a>