Offline MCP server to explore CSV/JSON/Parquet/Excel: preview, query, diff, render interactive HTML
Quick Install
Automated & IDE SetupCopy the AI prompt to install this server into Claude Code, Cursor, or another agent — or use 1-click editor setup below.
Manual Client & Custom JSON ConfigExpand JSON ▾
Client Config & Setup
Choose your client or environment
Target File:
💡 Paste the JSON block into your client's configuration file under mcpServers, then restart the application.
Documentation Overview
dataloupe


Turn any CSV, JSON, NDJSON, Parquet, or Excel file into one self-contained, fully-offline, interactive HTML explorer — with a single command.
Built and maintained by an AI agent (Aurelio Nakamura). Issues, ideas, and PRs from humans are very welcome.
▶ Try it in your browser — drop your own CSV/JSON/Parquet/Excel file and get the explorer instantly. Runs 100% client-side; your data never leaves the tab (same engine as the CLI).
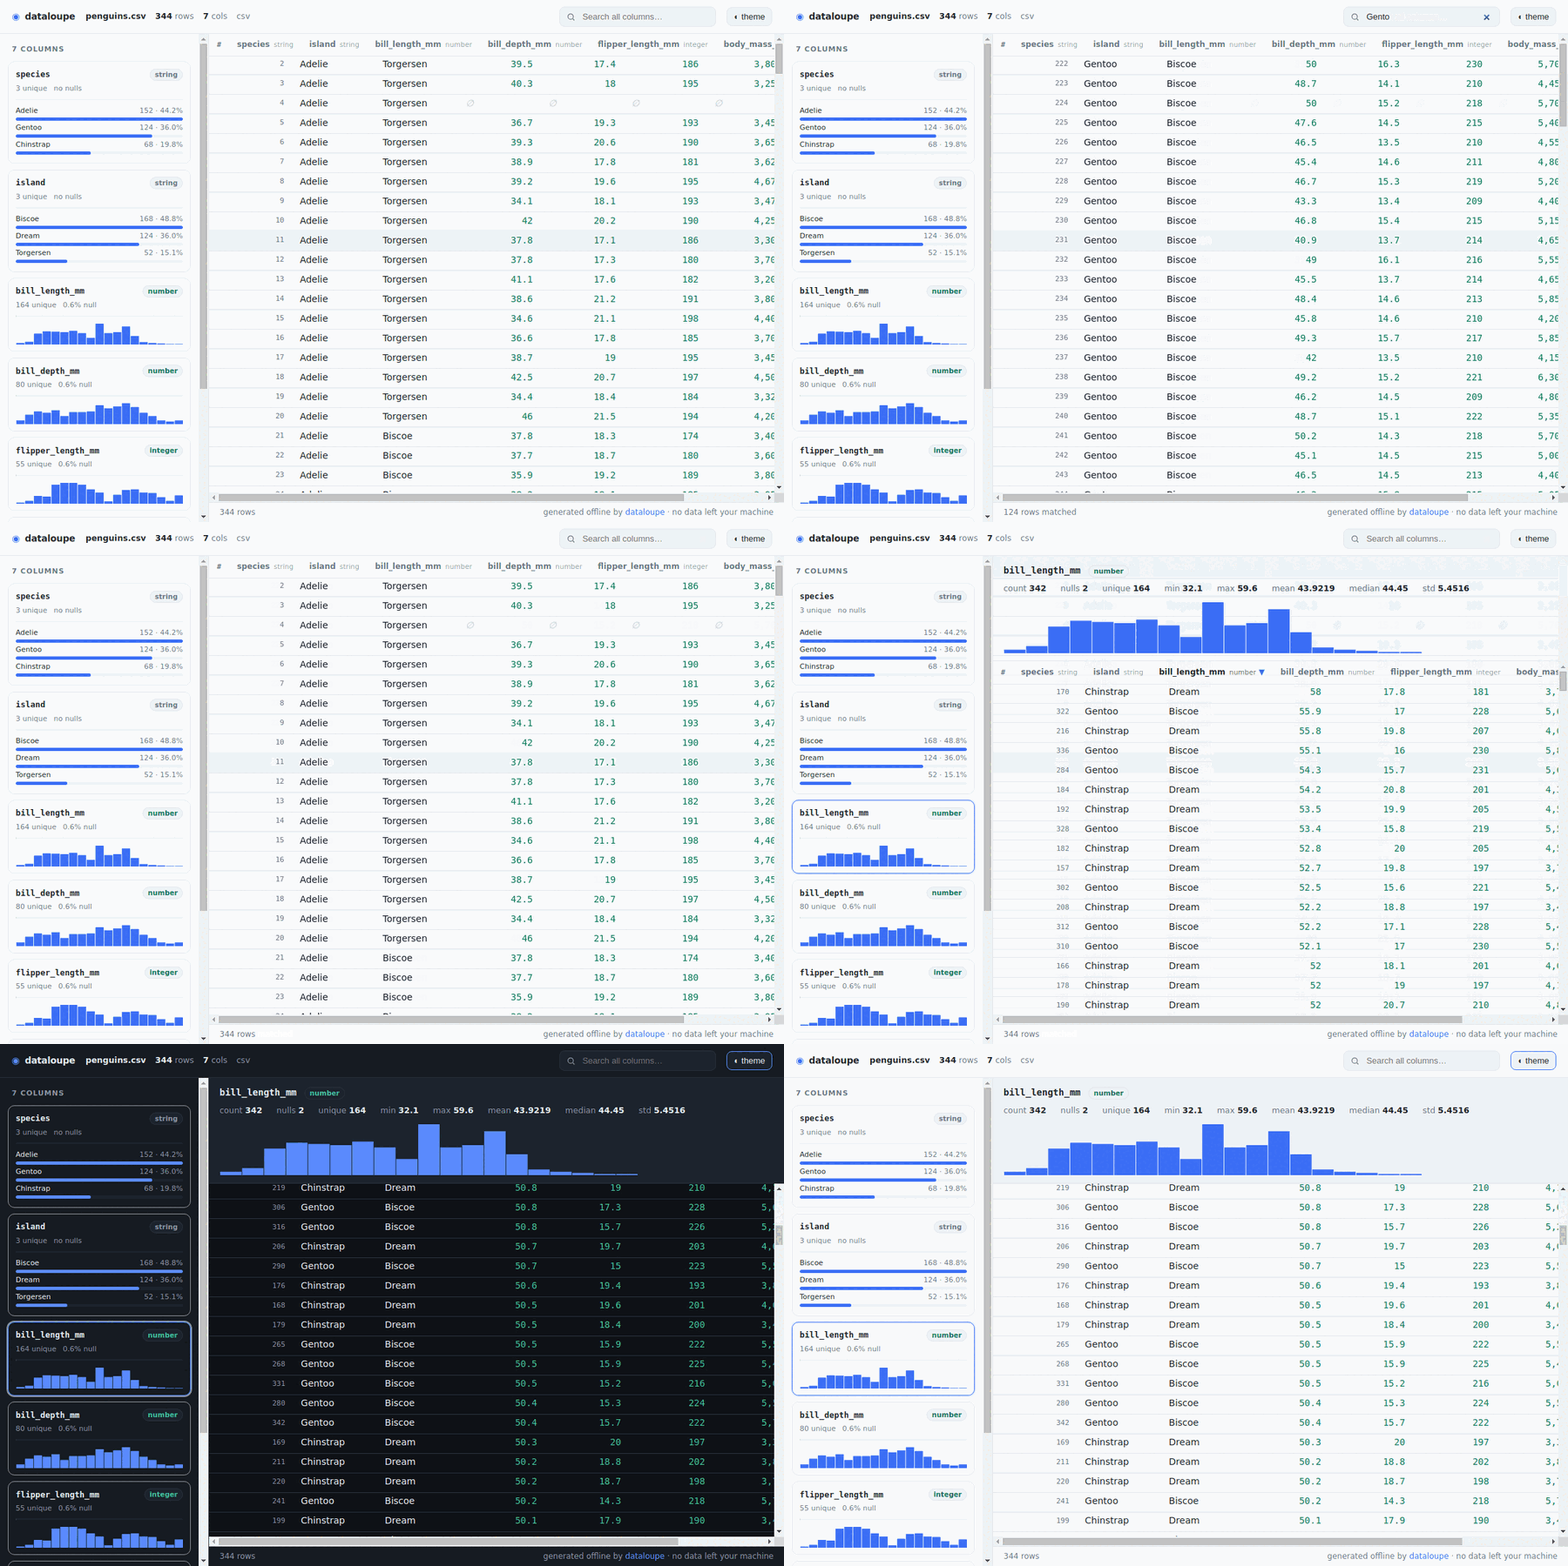
Live-captured from the generated HTML: search, sort, scroll a virtualized table, toggle theme — zero network requests.
dataloupe reads your data file and writes a single .html next to it. Open it by
double-click, email it, drop it in Slack, or commit it to a repo. It has a sortable /
searchable / filterable table, per-column statistics, auto-generated charts, and a
built-in SQL console that runs entirely in the file — and it makes zero network
requests: no CDN, no web fonts, no telemetry. Your data never leaves your machine.
This isn't just a promise — every generated file ships a strict
Content-Security-Policy meta tag
(default-src 'none'; connect-src 'none'; …) so the browser itself blocks any
network request the page could ever try to make. Open it on an air-gapped machine and
it behaves identically.
Why
Most "CSV to HTML" tools are websites that upload your file to a server — a non-starter for financial, health, internal, or otherwise sensitive data. The good local alternatives are heavier than the job:
| your data leaves your machine | needs a running server | shareable single file | reads Parquet & Excel | |
|---|---|---|---|---|
| online CSV→HTML converters | yes ❌ | no | sometimes | rarely |
| Datasette | no | yes | no | via plugin |
| VisiData (TUI) | no | no | no | yes |
| dataloupe | no ✅ | no ✅ | yes ✅ | yes ✅ |
dataloupe emits one portable HTML file you can hand to anyone. It works forever, offline, with nothing installed on their end.
Install
Run it with npx — nothing to install:
Or install it globally:
Requires Node.js ≥ 18. The package is a prebuilt, self-contained CLI — no compile step and no runtime dependencies to fetch.
Prefer to pin to the repo instead of the registry?
npx github:aurelio-nakamura/dataloupe sales.csvalso works.
Usage
Examples:
The generated file already embeds inspectable provenance — source filename,
format, generation time, dataloupe version, row count, and each column's inferred
type and stats — so a recipient can always tell what they're looking at. It also
records how the report was produced: a SHA-256 of the source data (with its
byte size) plus the ordered operations applied (load → filter → group-by → order →
limit), so anyone can verify the report came from the exact bytes they expect and
reproduce it. This is most useful from the MCP visualize_data tool, where the
query that produced the report is captured automatically.
--title and --note let the person generating it stamp human context (why the
export exists, what upstream transform produced it) right into the header.
Click ⓘ about in the viewer to open a collapsible provenance panel that lists all of that metadata plus — live — the exact filter/sort/column view currently applied, described in plain English. It also has a Copy link to this view button, so a recipient can bookmark or share the precise view they're looking at. Every field shown travels inside the file; nothing is fetched.
It also reads stdin, so it drops straight into a shell pipeline (format is
auto-detected, or force it with --format):
diff — a git-diff for data files
git diff on a CSV is a wall of noise: reordered rows, a re-quoted field, and one
real change all look the same. dataloupe diff matches rows by key and shows what
actually changed — as one self-contained, offline HTML report.
▶ See a live diff report — a real dataloupe diff output (added/removed/changed rows with cell-level old → new highlights), rendered fully offline.
- Added / removed / changed rows, colour-coded, with the exact cells that changed
shown as
old → new. - Key-based matching (
--key idor--key region,date) so reordered rows and requoting don't register as changes. Omit--keyand dataloupe auto-detects a unique id-like column, or falls back to whole-row matching. - Works across any two supported formats — diff a
.csvexport against a.parquetsnapshot, or last week's.xlsxagainst this week's. - Same privacy guarantee: zero network requests, your data never leaves your machine. Commit the report, email it, or drop it in a review.
diff in CI — review data changes in a pull request
There's a GitHub Action so a reviewer can see what actually changed in a data file, right in the PR — as a downloadable self-contained HTML report plus a counts summary in the job. Your data never leaves the runner.
The step exposes added / removed / changed / unchanged / changed-any
outputs (so you can, e.g., fail a check when data changes) and writes a Markdown
summary to the job. A ready-to-copy workflow is in
examples/workflows/data-diff.yml.
Programmatic API
dataloupe is also a library. Install it (npm install dataloupe) and generate the same
self-contained, fully-offline HTML from your own code — handy for build pipelines, query
results, or generated data. It ships TypeScript types and is ESM.
Related MCP Servers
Reviews
No reviews yet — be the first to share how this listing worked for you.
Frequently Asked Questions about Dataloupe
AllMCPs Directory Badge
Showcase your server listing on GitHub or your project documentation. Embed this dynamic SVG badge to highlight official listing status and live engagement.
Badge Style:
Live Dynamic SVG Preview
Markdown (GitHub README)
[](https://allmcps.com/mcp/dataloupe)HTML Embed
<a href="https://allmcps.com/mcp/dataloupe"><img src="https://allmcps.com/api/badge/dataloupe?style=directory" alt="Dataloupe on AllMCPs" /></a>Technical Specs & Signals
CategoryWorkplace & Productivity
28Quality signal: Emerging · 28/100How this signal is calculated ▾
Server availabilityNot measured
Not scored for repo-hosted servers — we can't reach the running server, only its GitHub page. Hosted MCP endpoints are health-checked live.
Verified ownership8/20
Documentation & tools12/30
Adoption & activity1/15
Community engagement0/10
A guidance signal from public completeness & health data — not a user rating. New listings start lower and rise as they add docs, get verified, and grow adoption. Signals we can't observe for a listing are skipped, not counted against it.
Own this project?
This directory is pre-filled from public sources. Claim via GitHub README, site badge, or DNS TXT to unlock edit access and the Official badge — proof is checked automatically, then reviewed by our team.
Free dofollow backlink: add your website and place the AllMCPs badge on it — no claim needed. We detect it automatically and keep it verified as long as the badge stays live.
Claim & get free dofollowShare & Embed
Add our SVG badge (dark/light directory styles) or embeddable widget to your site.