Air Q README
The full upstream README, mirrored here for reference. Install config, tool schemas, adoption signals, and an original overview live on the Air Q listing page.
mcp-airq







MCP server for air-Q air quality sensor devices. Enables Claude Desktop, Claude Code, and other MCP clients to directly query and configure air-Q devices on your local network.
Built on aioairq, the official async Python library for air-Q.
The same mcp-airq executable also works as a direct CLI when you pass a tool
name as a subcommand.
Installation
Or run directly with uvx:
CLI Usage
Use the same command directly from the shell:
For historical plots and exports:
- omit
device,location, andgroupto combine all configured devices into one artifact - use
locationorgroupto combine only the matching devices plot_air_quality_historyreturns one file per requested sensor, with one series per matching deviceexport_air_quality_historyreturns one CSV/XLSX file per request, with rows for all matching devices
The CLI subcommands mirror the MCP tool names. Both styles work:
To force MCP server mode from an interactive terminal, run:
The CLI is pipe-friendly: successful command output goes to stdout, while
tool errors go to stderr with exit code 1.
Device Configuration
Create a JSON file with your device(s), e.g. ~/.config/airq-devices.json:
Each entry requires:
address— IP address or mDNS hostname (e.g.abcde_air-q.local)password— Device password (default:airqsetup)name(optional) — Human-readable name; defaults to addresslocation(optional) — Physical room/area for grouping (e.g."Living Room")group(optional) — Second grouping dimension, orthogonal to location (e.g."Home","Work")
Then restrict access to the file (it contains passwords):
Alternatively, pass the device list inline via the AIRQ_DEVICES environment variable as a JSON string.
Claude Desktop
Add to your claude_desktop_config.json:
Claude Code
Register the server once via the CLI:
This writes to ~/.claude/settings.json and is automatically picked up by the Claude Code VSCode extension as well — no separate configuration needed.
If the server fails to connect: MCP servers run in a subprocess that may not inherit your shell's PATH. Replace
uvxwith its full path (which uvx→ e.g./home/you/.local/bin/uvx):
OpenAI Codex
Register the server once via the CLI:
This writes to ~/.codex/config.toml and is automatically picked up by the Codex VSCode extension as well.
If the server fails to connect: Use the full path to
uvx(see note above).
Available Tools
Read-Only
| Tool | Description |
|---|---|
list_devices | List all configured air-Q devices (with location/group if set) |
get_air_quality | Get sensor readings — by device, location, or group |
get_air_quality_history | Get historical sensor data as column-oriented JSON |
plot_air_quality_history | Render one historical chart per sensor across all matching devices |
export_air_quality_history | Export one historical sensor as one csv/xlsx across matching devices |
get_device_info | Get device metadata (name, model, firmware version) |
get_config | Get full device configuration |
get_logs | Get device log entries |
identify_device | Make device blink its LEDs for visual identification |
get_led_theme | Get current LED visualization theme |
get_possible_led_themes | List all available LED visualization themes |
get_night_mode | Get current night mode configuration |
get_brightness_config | Get current LED brightness configuration |
Configuration
| Tool | Description |
|---|---|
set_device_name | Rename a device |
set_led_theme | Change LED visualization (CO₂, VOC, Humidity, PM2.5, …) |
set_night_mode | Configure night mode schedule and settings |
set_brightness | Adjust LED brightness (day/night) |
configure_network | Set static IP or switch to DHCP |
Device Control
| Tool | Description |
|---|---|
restart_device | Restart the device (~30s downtime) |
shutdown_device | Shut down the device (manual restart required) |
Multi-Device Support
When multiple devices are configured, specify which device to query:
- By exact name:
"air-Q Pro" - By partial match (case-insensitive):
"pro","radon"
If only one device is configured, it is selected automatically.
Location and Group Queries
get_air_quality accepts two optional grouping parameters:
location— query all devices in the same room (e.g."Living Room")group— query all devices sharing a group tag (e.g."Home")
Both are independent: a device can have a location, a group, both, or neither. Matching is case-insensitive and substring-based.
Exactly one of device, location, or group may be specified per call.
Historical Data
Three tools provide access to data stored on the device's SD card:
Plotting charts
plot_air_quality_history renders a chart for one sensor. When multiple devices
match, each device becomes a separate series in the same chart.
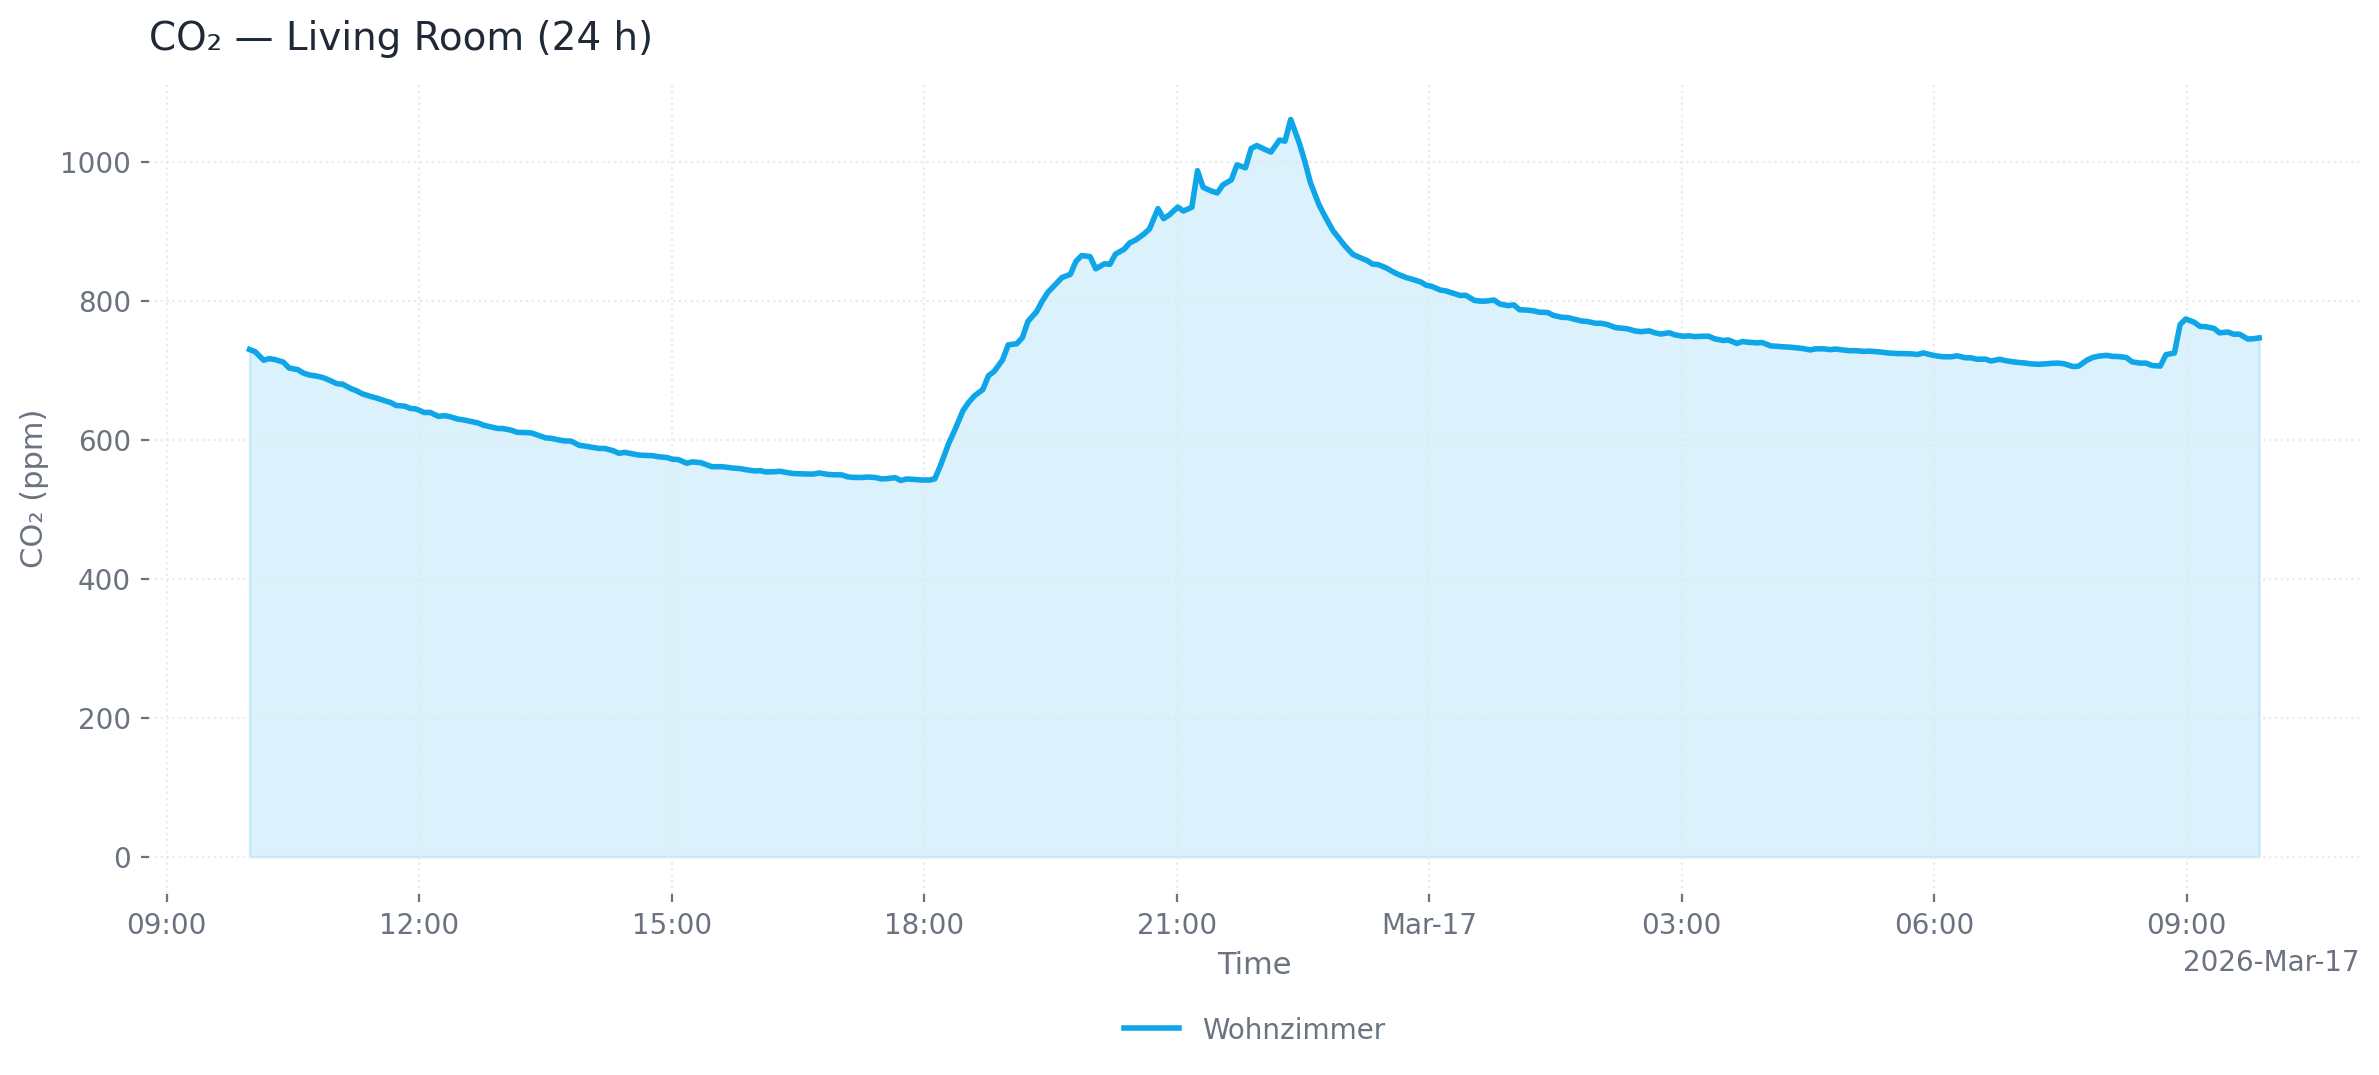
Single device (24 h, area chart, PNG)
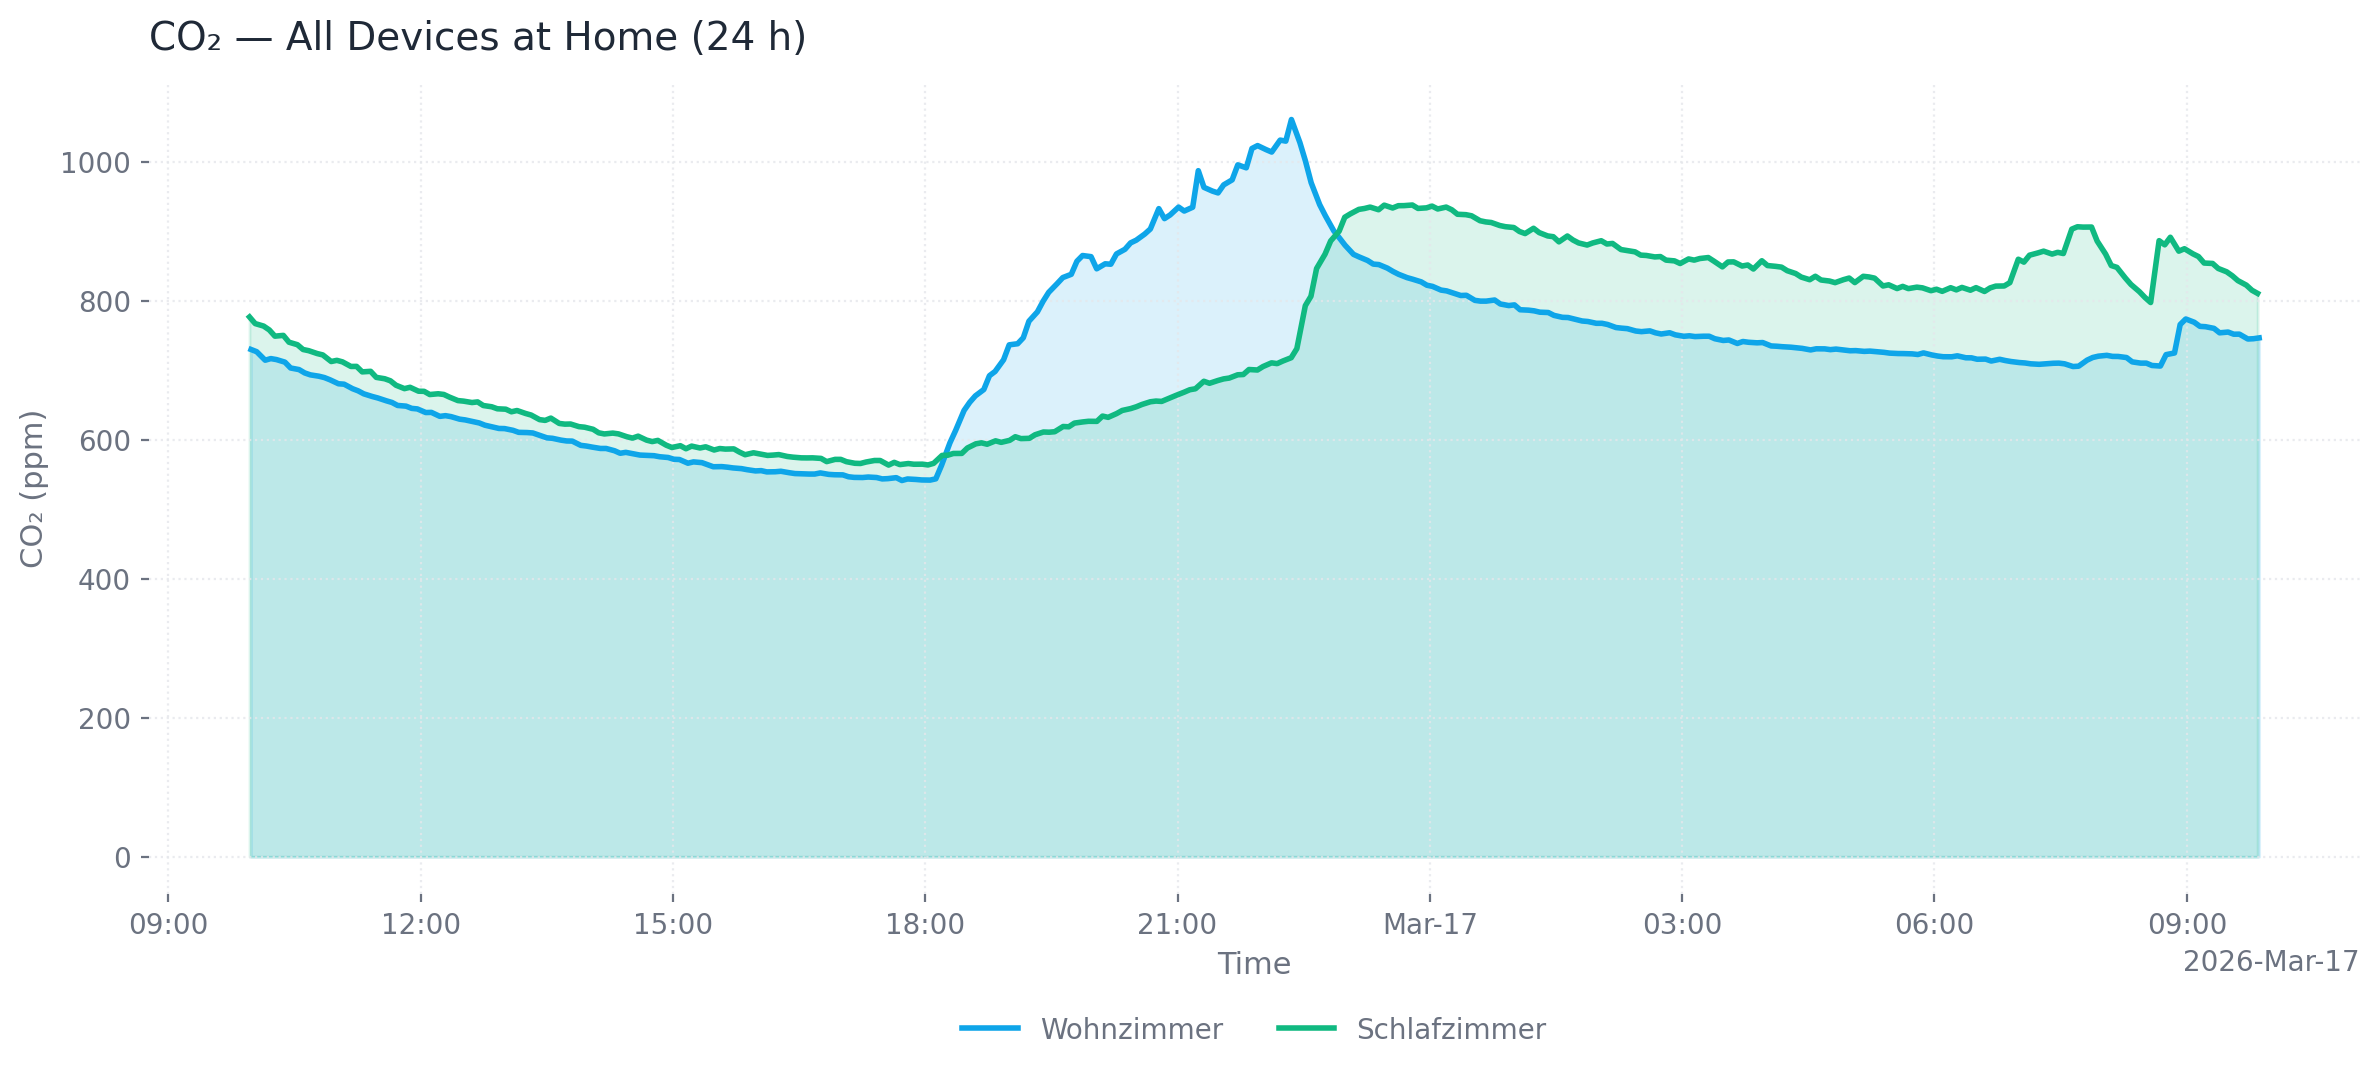
Multiple devices at one location (24 h, area chart, PNG)
Output formats: png (default), webp, svg, html (interactive Plotly chart with hover tooltips and zoom)
Customization: --title, --x-axis-title, --y-axis-title, --chart-type (line/area), --dark, --timezone-name
Exporting data
export_air_quality_history produces one CSV or Excel file containing all matching devices.
Querying raw JSON
get_air_quality_history returns column-oriented JSON, useful for programmatic analysis.
Common parameters
| Parameter | Default | Description |
|---|---|---|
--last-hours | 1 (history) / 24 (plot) | Hours of data to retrieve |
--from-datetime / --to-datetime | — | ISO 8601 time range (overrides --last-hours) |
--max-points | 300 | Downsample to at most N evenly spaced points |
--timezone-name | UTC | IANA timezone for timestamps (e.g. Europe/Berlin) |
Example Prompts
- "How is the air quality in the living room?" — queries all devices at that location
- "What's the air quality at home?" — queries all devices in the "Home" group
- "Show the CO₂ trend over the last 12 hours as SVG"
- "Export the radon history from yesterday as Excel"
- "Show me the radon level" — targets the air-Q Radon device by name
- "Show CO₂ on the LEDs"
- "Enable night mode from 10 PM to 7 AM"
- "Set brightness to 50%"
- "What's in the device log?"
- "Make the air-Q blink"
Development
The repository uses a project-local .venv plus uv.lock for reproducible tooling.
Run all developer commands through uv run, for example:
Release Process
- Update
versioninpyproject.toml. - Commit and create a matching Git tag like
v0.1.1. - Publish a GitHub Release from that tag.
The publish workflow validates that the release tag matches pyproject.toml, uploads the package to PyPI, and then publishes the same version to the MCP Registry.
License
Apache License 2.0 — see LICENSE.