MCP server for direct HTTP communication with air-Q air quality sensor devices
Quick Install
Automated & IDE SetupCopy the AI prompt to install this server into Claude Code, Cursor, or another agent — or use 1-click editor setup below.
Not yet automatically verified
We haven't yet run this listing's install command through our automated sandbox check. This isn't a red flag — we're steadily working through the catalog.
Manual Client & Custom JSON ConfigExpand JSON ▾
Client Config & Setup
Choose your client or environment
Target File:
💡 Paste the JSON block into your client's configuration file under mcpServers, then restart the application.
Capabilities & Tool Schemas (20)
Inspect callable tools, capabilities, and parameters exposed to AI agents by Air Q.
list_devicesList all configured air-Q devices (with location/group if set)
get_air_qualityGet sensor readings — by `device`, `location`, or `group
get_air_quality_historyGet historical sensor data as column-oriented JSON
plot_air_quality_historyRender one historical chart per sensor across all matching devices
export_air_quality_historyExport one historical sensor as one `csv`/`xlsx` across matching devices
get_device_infoGet device metadata (name, model, firmware version)
Documentation Overview
mcp-airq







MCP server for air-Q air quality sensor devices. Enables Claude Desktop, Claude Code, and other MCP clients to directly query and configure air-Q devices on your local network.
Built on aioairq, the official async Python library for air-Q.
The same mcp-airq executable also works as a direct CLI when you pass a tool
name as a subcommand.
Installation
Or run directly with uvx:
CLI Usage
Use the same command directly from the shell:
For historical plots and exports:
- omit
device,location, andgroupto combine all configured devices into one artifact - use
locationorgroupto combine only the matching devices plot_air_quality_historyreturns one file per requested sensor, with one series per matching deviceexport_air_quality_historyreturns one CSV/XLSX file per request, with rows for all matching devices
The CLI subcommands mirror the MCP tool names. Both styles work:
To force MCP server mode from an interactive terminal, run:
The CLI is pipe-friendly: successful command output goes to stdout, while
tool errors go to stderr with exit code 1.
Device Configuration
Create a JSON file with your device(s), e.g. ~/.config/airq-devices.json:
Each entry requires:
address— IP address or mDNS hostname (e.g.abcde_air-q.local)password— Device password (default:airqsetup)name(optional) — Human-readable name; defaults to addresslocation(optional) — Physical room/area for grouping (e.g."Living Room")group(optional) — Second grouping dimension, orthogonal to location (e.g."Home","Work")
Then restrict access to the file (it contains passwords):
Alternatively, pass the device list inline via the AIRQ_DEVICES environment variable as a JSON string.
Claude Desktop
Add to your claude_desktop_config.json:
Claude Code
Register the server once via the CLI:
This writes to ~/.claude/settings.json and is automatically picked up by the Claude Code VSCode extension as well — no separate configuration needed.
If the server fails to connect: MCP servers run in a subprocess that may not inherit your shell's PATH. Replace
uvxwith its full path (which uvx→ e.g./home/you/.local/bin/uvx):
OpenAI Codex
Register the server once via the CLI:
This writes to ~/.codex/config.toml and is automatically picked up by the Codex VSCode extension as well.
If the server fails to connect: Use the full path to
uvx(see note above).
Available Tools
Read-Only
| Tool | Description |
|---|---|
list_devices | List all configured air-Q devices (with location/group if set) |
get_air_quality | Get sensor readings — by device, location, or group |
get_air_quality_history | Get historical sensor data as column-oriented JSON |
plot_air_quality_history | Render one historical chart per sensor across all matching devices |
export_air_quality_history | Export one historical sensor as one csv/xlsx across matching devices |
get_device_info | Get device metadata (name, model, firmware version) |
get_config | Get full device configuration |
get_logs | Get device log entries |
identify_device | Make device blink its LEDs for visual identification |
get_led_theme | Get current LED visualization theme |
get_possible_led_themes | List all available LED visualization themes |
get_night_mode | Get current night mode configuration |
get_brightness_config | Get current LED brightness configuration |
Configuration
| Tool | Description |
|---|---|
set_device_name | Rename a device |
set_led_theme | Change LED visualization (CO₂, VOC, Humidity, PM2.5, …) |
set_night_mode | Configure night mode schedule and settings |
set_brightness | Adjust LED brightness (day/night) |
configure_network | Set static IP or switch to DHCP |
Device Control
| Tool | Description |
|---|---|
restart_device | Restart the device (~30s downtime) |
shutdown_device | Shut down the device (manual restart required) |
Multi-Device Support
When multiple devices are configured, specify which device to query:
- By exact name:
"air-Q Pro" - By partial match (case-insensitive):
"pro","radon"
If only one device is configured, it is selected automatically.
Location and Group Queries
get_air_quality accepts two optional grouping parameters:
location— query all devices in the same room (e.g."Living Room")group— query all devices sharing a group tag (e.g."Home")
Both are independent: a device can have a location, a group, both, or neither. Matching is case-insensitive and substring-based.
Exactly one of device, location, or group may be specified per call.
Historical Data
Three tools provide access to data stored on the device's SD card:
Plotting charts
plot_air_quality_history renders a chart for one sensor. When multiple devices
match, each device becomes a separate series in the same chart.
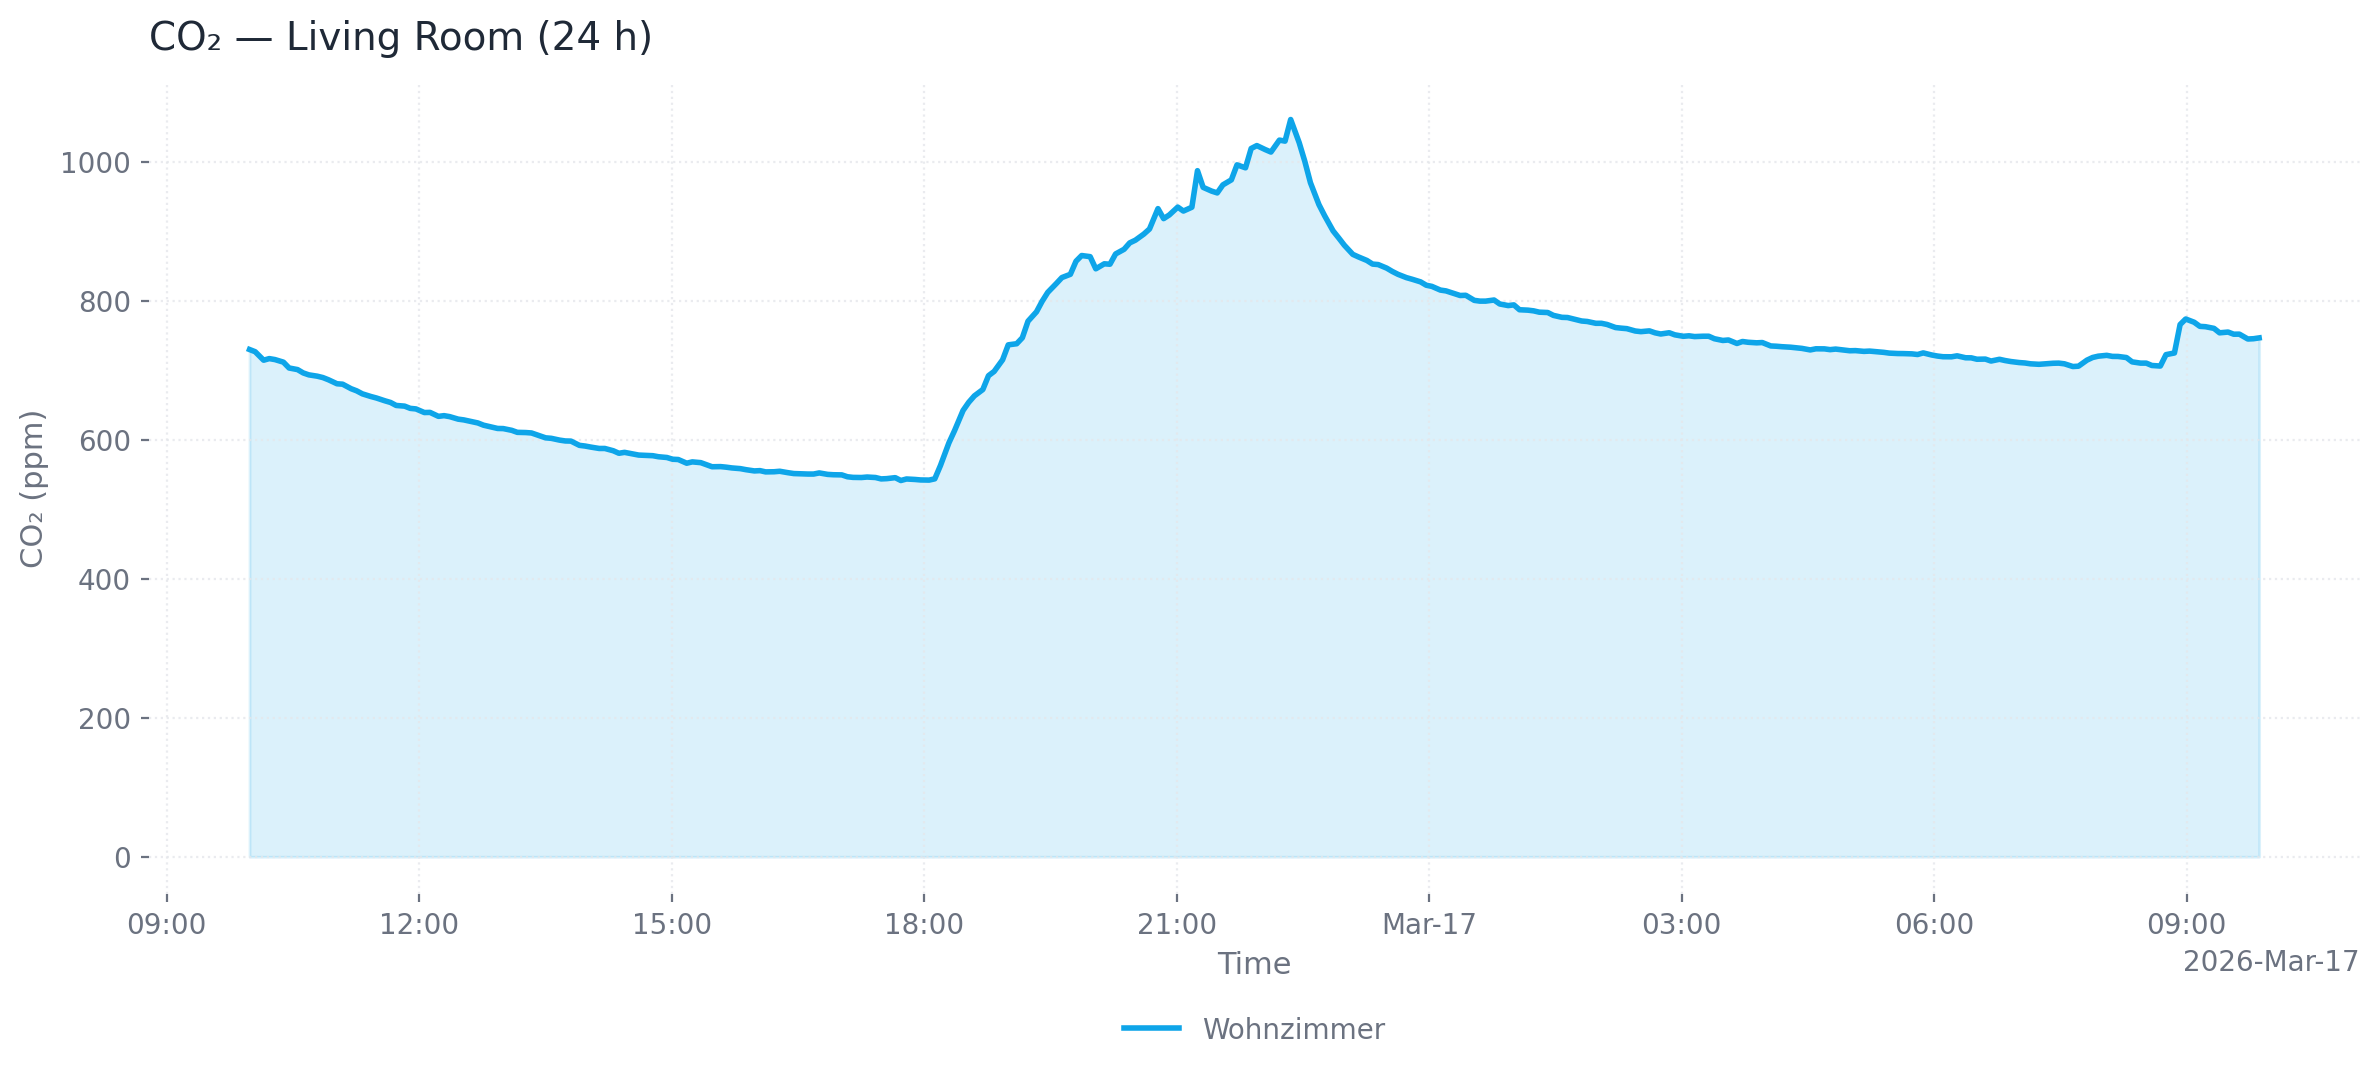
Single device (24 h, area chart, PNG)
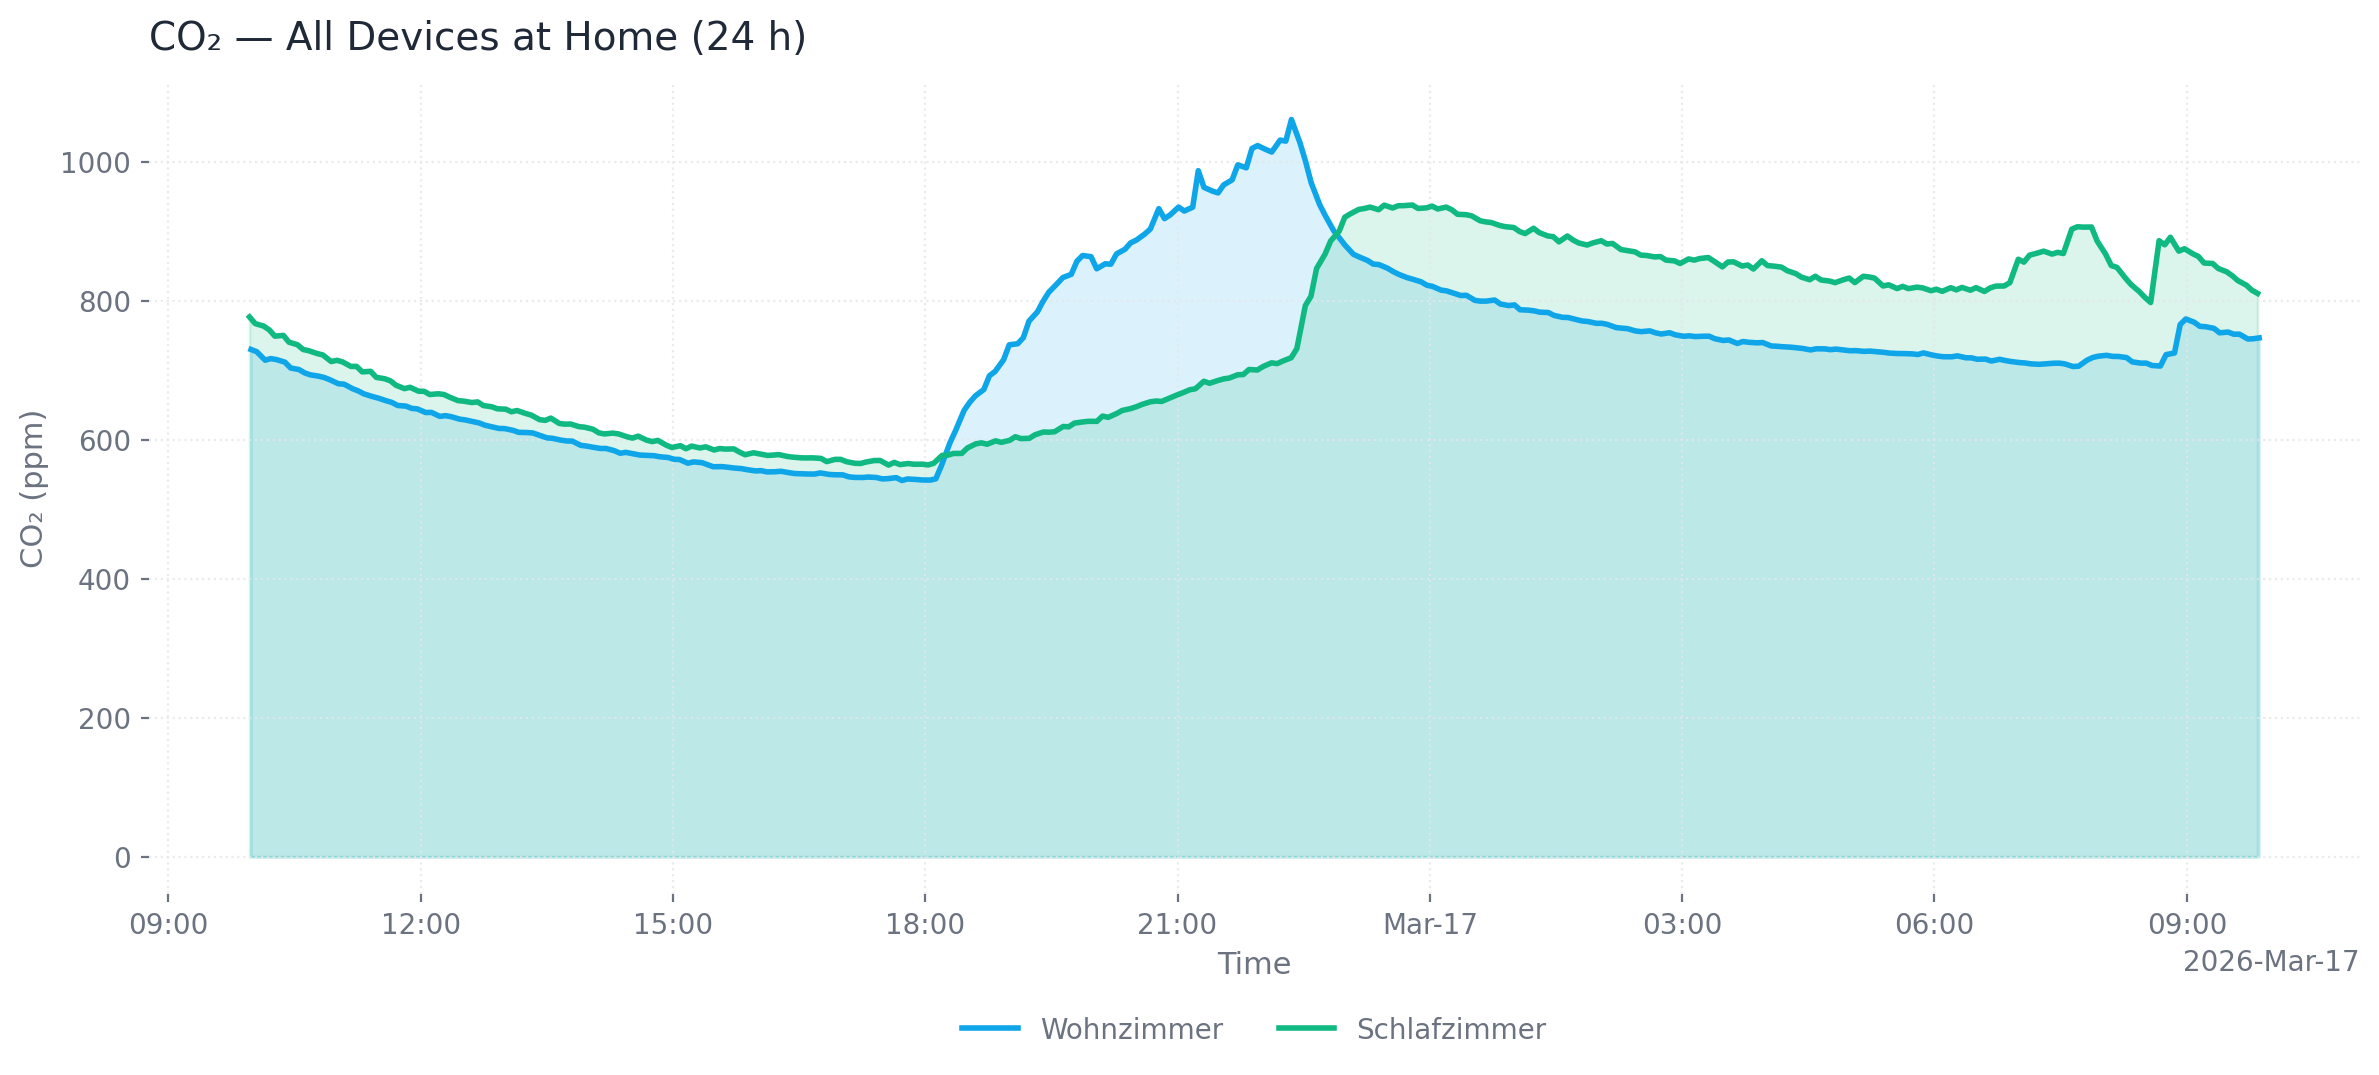
Multiple devices at one location (24 h, area chart, PNG)
Output formats: png (default), webp, svg, html (interactive Plotly chart with hover tooltips and zoom)
Customization: --title, --x-axis-title, --y-axis-title, --chart-type (line/area), --dark, --timezone-name
Exporting data
export_air_quality_history produces one CSV or Excel file containing all matching devices.
Related MCP Servers
Adoption & maintenance
Factual signals from GitHub, npm, and our automated checks — not a rating.
Last commit
1mo ago
Most recent push to the default branch.
Tools exposed
20
Callable tools this server registers over MCP.
Reviews
No reviews yet — be the first to share how this listing worked for you.
Frequently Asked Questions about Air Q
AllMCPs Directory Badge
Showcase your server listing on GitHub or your project documentation. Embed this dynamic SVG badge to highlight official listing status and live engagement.
Badge Style:
Live Dynamic SVG Preview
Markdown (GitHub README)
[](https://allmcps.com/mcp/air-q)HTML Embed
<a href="https://allmcps.com/mcp/air-q"><img src="https://allmcps.com/api/badge/air-q?style=directory" alt="Air Q on AllMCPs" /></a>Technical Specs & Signals
CategoryDeveloper Tools
13/13 checks healthy over the last 46d
48Quality signal: Fair · 48/100How this signal is calculated ▾
Server availabilityNot measured
Not scored for repo-hosted servers — we can't reach the running server, only its GitHub page. Hosted MCP endpoints are health-checked live.
Verified ownership10/20
Documentation & tools24/30
Adoption & activity2/15
Community engagement0/10
A guidance signal from public completeness & health data — not a user rating. New listings start lower and rise as they add docs, get verified, and grow adoption. Signals we can't observe for a listing are skipped, not counted against it.
Supply-chain signal
No high-severity advisories surfaced by our automated scan.
Critical 0High 0Medium 0Low 0
Scanned 3d ago via OSV.dev · mcp-airq (PyPI)
Own this project?
This directory is pre-filled from public sources. Claim via GitHub README, site badge, or DNS TXT to unlock edit access and the Official badge — proof is checked automatically, then reviewed by our team.
Free dofollow backlink: add your website and place the AllMCPs badge on it — no claim needed. We detect it automatically and keep it verified as long as the badge stays live.
Claim & get free dofollowShare & Embed
Add our SVG badge (dark/light directory styles) or embeddable widget to your site.