Architecture diagram with concurrency capacity and bottleneck estimates from any codebase.
Quick Install
Automated & IDE SetupCopy the AI prompt to install this server into Claude Code, Cursor, or another agent — or use 1-click editor setup below.
One-click editor setup isn’t available for this listing yet — we don’t have a confirmed install command, and we’d rather show nothing than point your editor at the wrong package or host. Follow the project’s own setup instructions, linked above.
Manual Client & Custom JSON ConfigExpand JSON ▾
No confirmed setup config for this listing yet. We only publish a config block when the install details come from the project itself — its README, its docs, or a verified owner. We haven’t found those for Workflow Generator, and we’d rather show nothing than a guess you’d paste into your client. Follow the project’s own setup instructions for the current steps.
Documentation Overview
workflow-generator
Scan any project and generate WORKFLOW.html — a dark-mode visual system diagram showing every component, how they talk to each other, and where your throughput ceiling actually is.
Works with Python, Node.js, Go, Java, Rust, Ruby, and mixed projects. No external dependencies for the core scanner.
Vendored and generated directories (node_modules, venv, site-packages, dist, …) are never scanned,
and capacity figures are clearly labeled as static-analysis estimates.
Live demo → — generated from fastapi/full-stack-fastapi-template, unmodified.
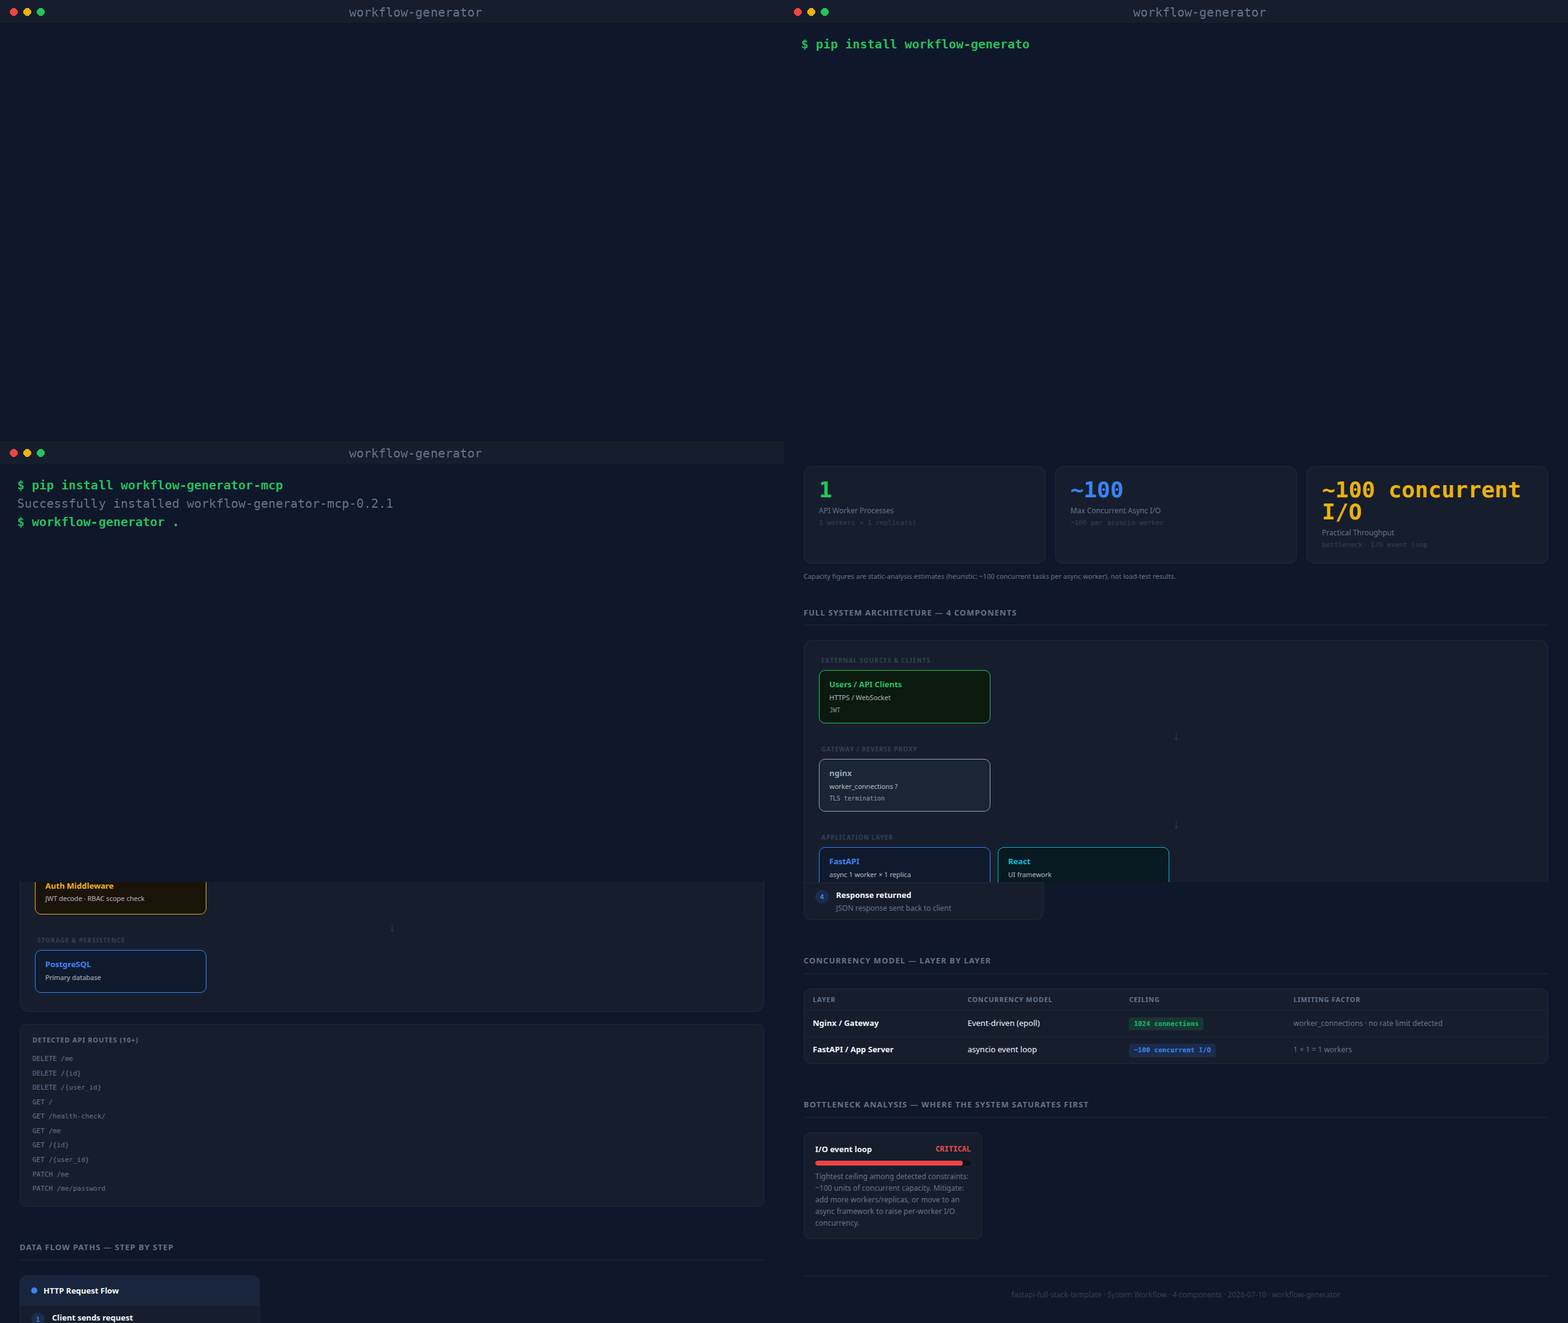
(real CLI output, unscripted — static screenshot if you'd rather not autoplay)
What it produces
Every generated page contains:
| Section | What you get |
|---|---|
| Stat row | Workers · Concurrent I/O ceiling · Semaphore limit · Rate limit · Practical throughput |
| Architecture diagram | Layered flow: external sources → gateway → API → queues → AI → storage |
| Data flow cards | Write path, read/query path, background jobs — inferred from what's detected |
| Concurrency table | Every layer: model · ceiling · limiting factor |
| Bottleneck analysis | Ranked CRITICAL → LOW with mitigation notes |
| Codebase dependency graph | Force-directed module/import graph — click a node to isolate its neighbors, hover for file details. Import-direction edges are clearly distinguished from real observed traffic (see below) |
| Guided tour | Spotlight walkthrough of every section, shown automatically the first time a report is opened; replay anytime with the ? button |
Codebase dependency graph
Every source file (Python, JS/TS, Go, Java, Rust, Ruby) becomes a node; every real import becomes
an edge — resolved with a language-appropriate parser (Python's ast module, regex for JS/TS/Go/
Java/Rust/Ruby), not guessed. Files that match an already-detected component (an LLM call, a
database client, a queue) get an edge to that component too, so you can see exactly which files
talk to Redis, OpenAI, etc. Large repos (350+ files) are automatically aggregated into
directory-level nodes so the graph stays readable; override with --graph-detail files or
--graph-detail dirs.
By default the graph only shows what the code says (import direction, static "this file calls
Redis"), which is honest but not the same as real traffic. Pass --access-log /path/to/access.log
(any combined/common log format) to overlay real observed request counts onto the HTTP-entry
edges — and the generated report includes a ready-to-run k6 load-test script
covering up to 5 detected routes, so the "Practical throughput" number can be checked against a
real measurement instead of only a static-analysis estimate.
What it detects
| Category | Examples |
|---|---|
| API frameworks | FastAPI, Flask, Django, Express, Nest.js, Gin |
| Gateways | nginx, Caddy, Traefik (with rate limits + worker_connections) |
| LLM providers | OpenAI, Anthropic Claude, Cohere, AWS Bedrock |
| Vector stores | Qdrant, Pinecone, Weaviate, ChromaDB, pgvector, FAISS, Milvus |
| Databases | PostgreSQL, MySQL, MongoDB, SQLite, Redis |
| Queues | Celery, BullMQ, Kafka, RabbitMQ, RQ, AWS SQS |
| Async primitives | asyncio.Semaphore, run_in_executor, asyncio.gather, asyncio.Lock |
| Workers | --workers N (uvicorn/gunicorn), replicas: (docker-compose), PM2 instances |
| External sources | Jira, Azure DevOps, Slack, GitHub, Stripe, Salesforce, Twilio |
| Evaluation | TruLens, RAGAS, LangSmith |
Install
pip (CLI + MCP server)
With pip installed, any MCP host config reduces to:
Claude Code (skill)
Then in any Claude Code session:
MCP server (Claude Desktop, VS Code, Cursor, Zed, Windsurf, Continue)
1. Install the dependency:
2. Add to your MCP host config (replace ~ with your actual home path):
Claude Desktop
~/Library/Application Support/Claude/claude_desktop_config.json (Mac)
%APPDATA%\Claude\claude_desktop_config.json (Windows)
VS Code
.vscode/mcp.json
Cursor
~/.cursor/mcp.json
Zed
.zed/settings.json
Windsurf
~/.windsurf/mcp_config.json
3. Restart your tool, then ask:
MCP tools exposed:
generate_workflow— scans project, writesWORKFLOW.html, optionally opens in browseranalyze_workflow— returns structured JSON summary (no file written)
Command line (standalone)
No install needed beyond Python 3.8+:
Optional flags:
Example output (terminal)
Repo layout
License
MIT
Related MCP Servers
Adoption & maintenance
Factual signals from GitHub, npm, and our automated checks — not a rating.
Last commit
1mo ago
Most recent push to the default branch.
Directory activity
1 views
Config copies, upvotes, and views on AllMCPs.
Reviews
No reviews yet — be the first to share how this listing worked for you.
Frequently Asked Questions about Workflow Generator
AllMCPs Directory Badge
Showcase your server listing on GitHub or your project documentation. Embed this dynamic SVG badge to highlight official listing status and live engagement.
Badge Style:
Live Dynamic SVG Preview
Markdown (GitHub README)
[](https://allmcps.com/mcp/workflow-generator)HTML Embed
<a href="https://allmcps.com/mcp/workflow-generator"><img src="https://allmcps.com/api/badge/workflow-generator?style=directory" alt="Workflow Generator on AllMCPs" /></a>Technical Specs & Signals
CategoryDeveloper Tools
7/11 checks healthy over the last 45d
31Quality signal: Emerging · 31/100How this signal is calculated ▾
Server availabilityNot measured
Not scored for repo-hosted servers — we can't reach the running server, only its GitHub page. Hosted MCP endpoints are health-checked live.
Verified ownership10/20
Documentation & tools11/30
Adoption & activity2/15
Community engagement0/10
A guidance signal from public completeness & health data — not a user rating. New listings start lower and rise as they add docs, get verified, and grow adoption. Signals we can't observe for a listing are skipped, not counted against it.
Supply-chain signal
No high-severity advisories surfaced by our automated scan.
Critical 0High 0Medium 0Low 0
Scanned 8/19/2026 via OSV.dev
Own this project?
This directory is pre-filled from public sources. Claim via GitHub README, site badge, or DNS TXT to unlock edit access and the Official badge — proof is checked automatically, then reviewed by our team.
Free dofollow backlink: add your website and place the AllMCPs badge on it — no claim needed. We detect it automatically and keep it verified as long as the badge stays live.
Claim & get free dofollowShare & Embed
Add our SVG badge (dark/light directory styles) or embeddable widget to your site.