Uptimepage README
The full upstream README, mirrored here for reference. Install config, tool schemas, adoption signals, and an original overview live on the Uptimepage listing page.
uptimepage
Uptime monitoring, status pages and on-call. Open source, free to start. Live in 5 minutes.
Monitor HTTP, TCP, ICMP ping, cron-job heartbeats, DNS, TLS-certificate and domain expiry, plus scripted browser login flows, from multiple regions — then turn green and red into a polished public status page your customers can subscribe to, and page whoever is on call through rotations and escalation policies. Drive it by click, REST API, or Terraform. Self-host the single binary or use the hosted service.




Try it free → · Docs · Self-host · Terraform · MCP
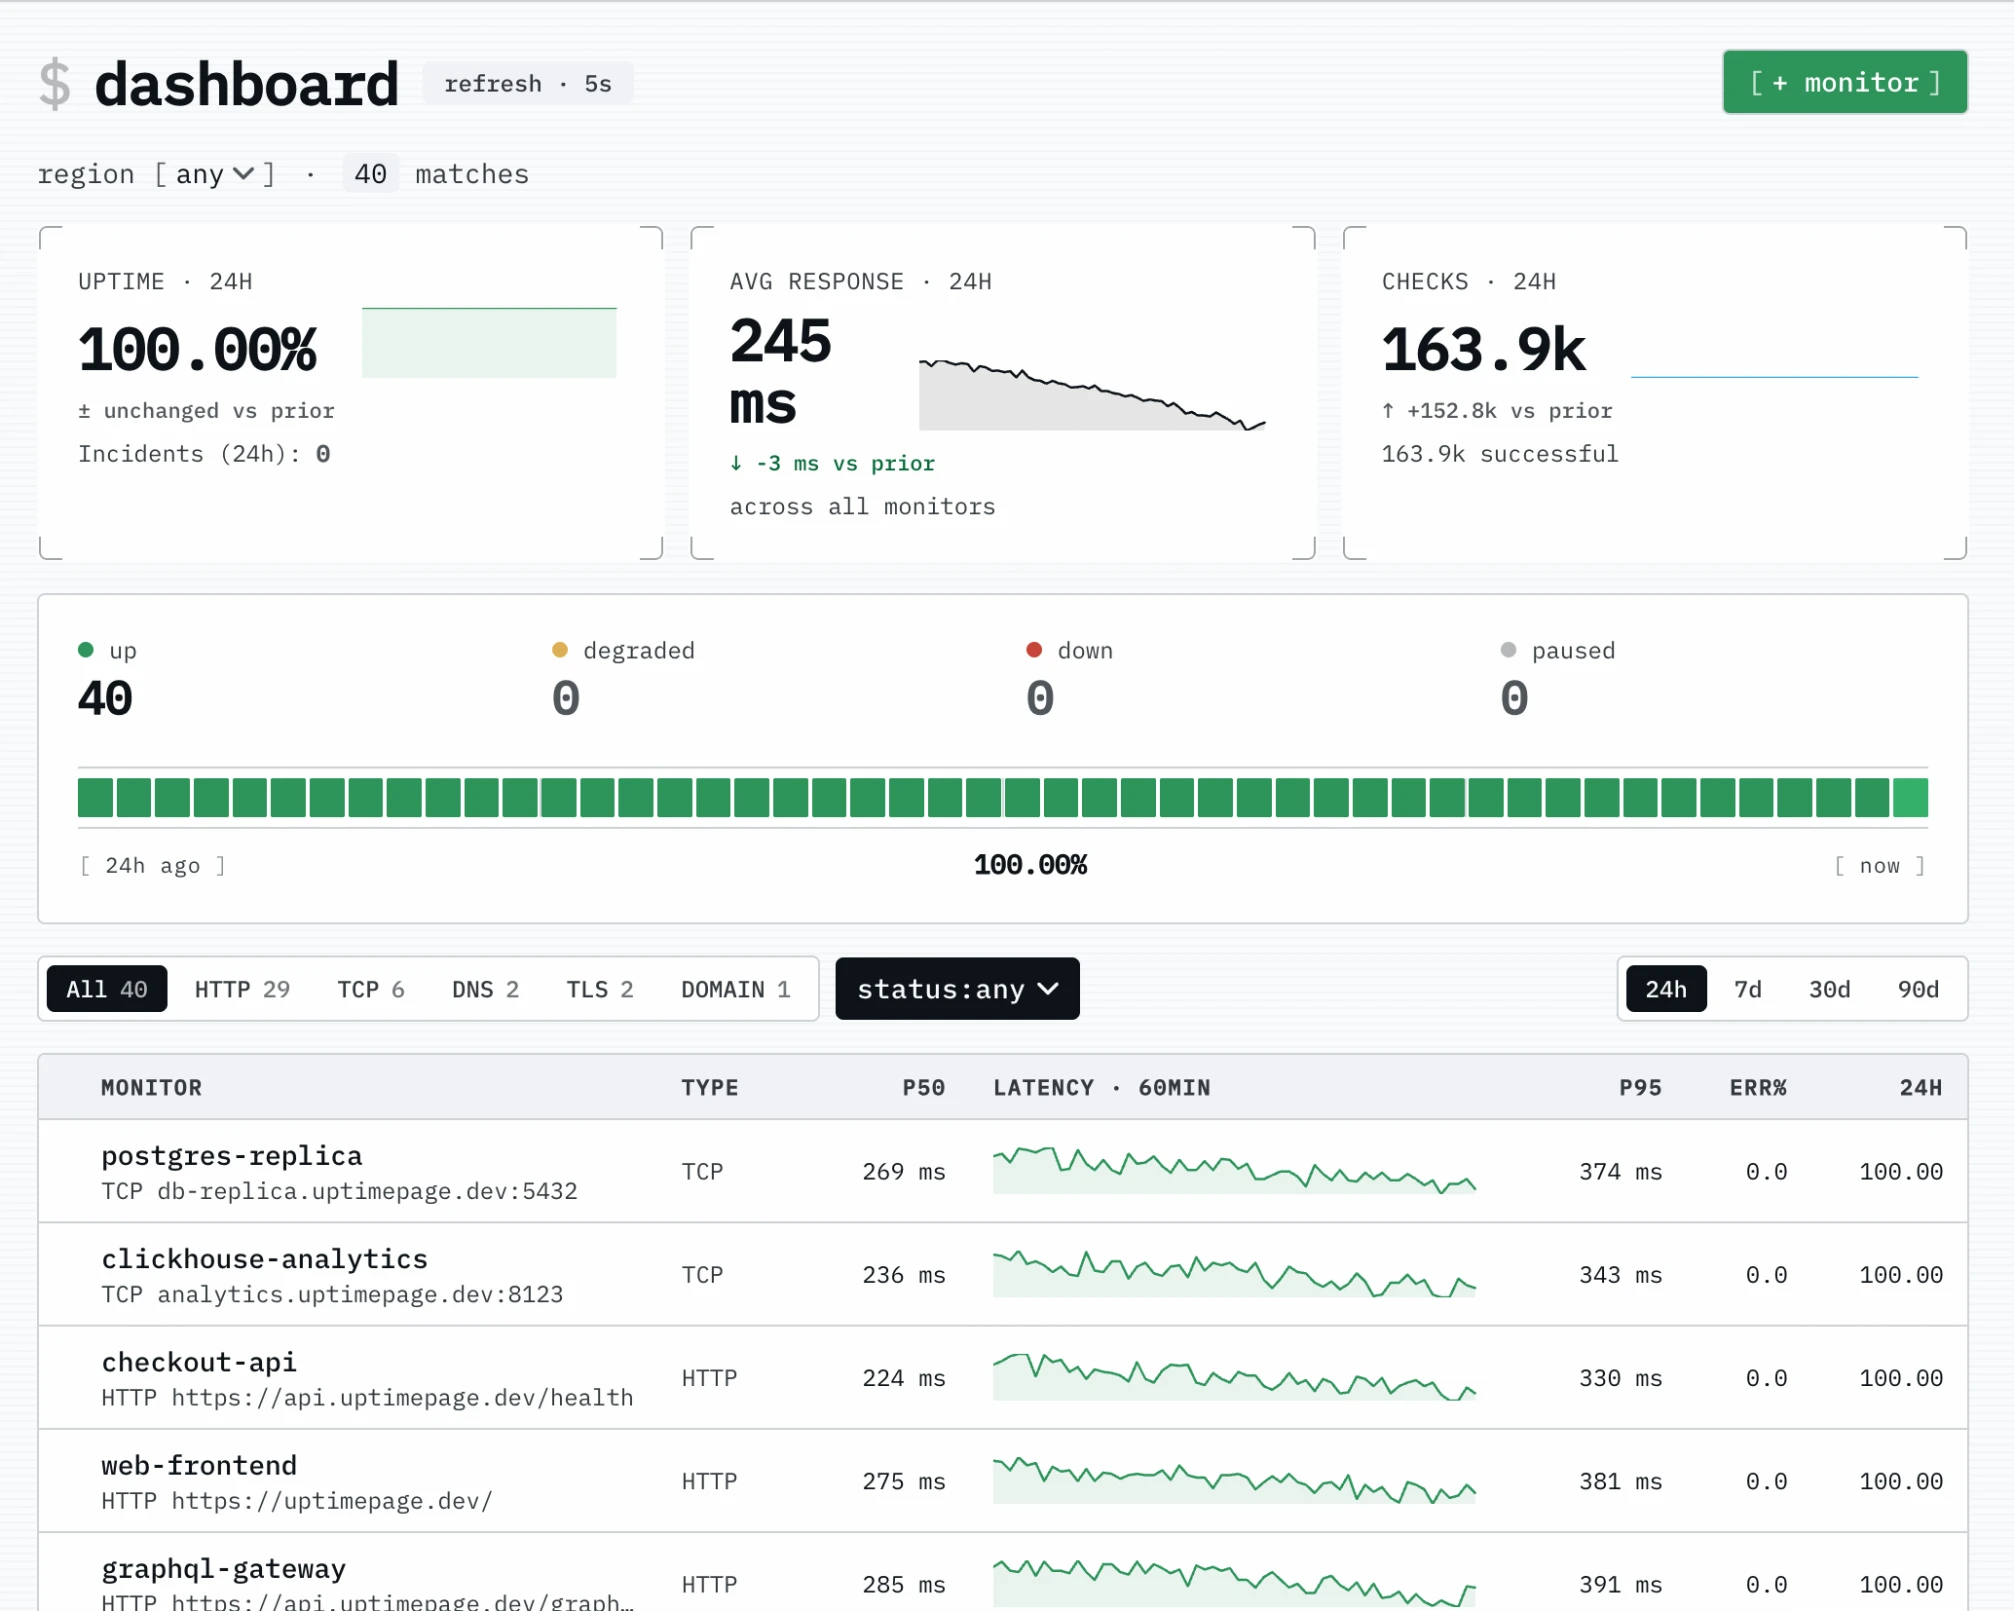
Quick start
Hosted, no install:
- Sign up at uptimepage.dev with GitHub, Google or your email address — no card.
- Add a monitor: paste a URL, pick a check type and interval, save.
- Bind a notification channel (Slack, email, PagerDuty, …) so failures reach you.
- Turn on a public status page and share the link.
Prefer code? Drive the same account by REST API, Terraform, or MCP. Want to run it yourself? Go to Self-host.
Why uptimepage
Monitoring with a built-in status page isn't new — the bet here is doing it free, self-hostable, and fully as code:
- Free hosted tier, no card — and AGPL if you'd rather run it yourself.
- One self-contained binary —
docker compose upand you're live, not a Kubernetes platform to operate. - Everything as code — REST API, scoped tokens, an official Terraform provider, and an MCP server your LLM can query.
- Probes you own — run multi-region agents wherever your users are, on your own boxes.
- Status page + incidents + on-call in one — components, subscribers, on-call rotations and escalation, and multi-channel paging that repeats until acknowledged, no second tool.
- Core isn't paywalled — checks, status pages, subscribers, the API and every alert channel are in the free tier.
Who it's for
- Founders / small SaaS — a professional status page in minutes, free, no self-host headache.
- Platform / SRE leads — monitors as code, multi-region probes, incident paging to your on-call channels, without vendor sprawl.
- Self-hosters — one binary plus two databases, no SaaS lock-in.
Live status
uptimepage monitors itself. These badges are served by the running app from a public status page — no third-party service, no cron job updating a JSON file.

| Surface | HTTP | DNS | TLS cert | Domain |
|---|---|---|---|---|
| uptimepage.dev (website) |  |  |  |  |
| app.uptimepage.dev (dashboard) |  | |||
| mcp.uptimepage.dev (MCP) |  |
Embed your own with the snippet in Settings → Pages → your page → Badge.
Features
| Checks | HTTP, TCP, ICMP ping, heartbeat (inbound dead-man's-switch), DNS, TLS-cert expiry, domain expiry, browser login flow with per-step timings, manual (state set by an operator); per-host circuit breaking, designed for ~50k concurrent in-flight |
| Public status page | HTML + JSON + RSS, per-component opt-in, incident narration, maintenance windows, email + webhook subscribers |
| Alerting | Slack, PagerDuty, Discord, Microsoft Teams, Google Chat, Mattermost, Telegram, WhatsApp, SMS, email, webhook, ntfy, Gotify, Pushover — per-org channels, sealed secrets, fire-once + recovery, repeat until acknowledged |
| Incidents | Internal incident state ⊥ public phase, acknowledge to silence paging, per-monitor reminder cadence |
| On-call | Layered rotations (daily, weekly, custom) with weekly hours, calendar overrides, your shifts as an iCalendar feed, escalation policies that page channels and schedules level by level |
| Multi-region | Regional probe agents, per-region views, run your own agent anywhere |
| Automation | REST API, scoped API tokens, Terraform provider, MCP server for LLM clients |
| Built on | Rust 1.95 / Tokio / Axum, Postgres + ClickHouse, one ~23 MB self-contained binary |
Live service: https://uptimepage.dev — hosted, free, sign in with GitHub, Google or your email address. Full docs: https://uptimepage.dev/docs
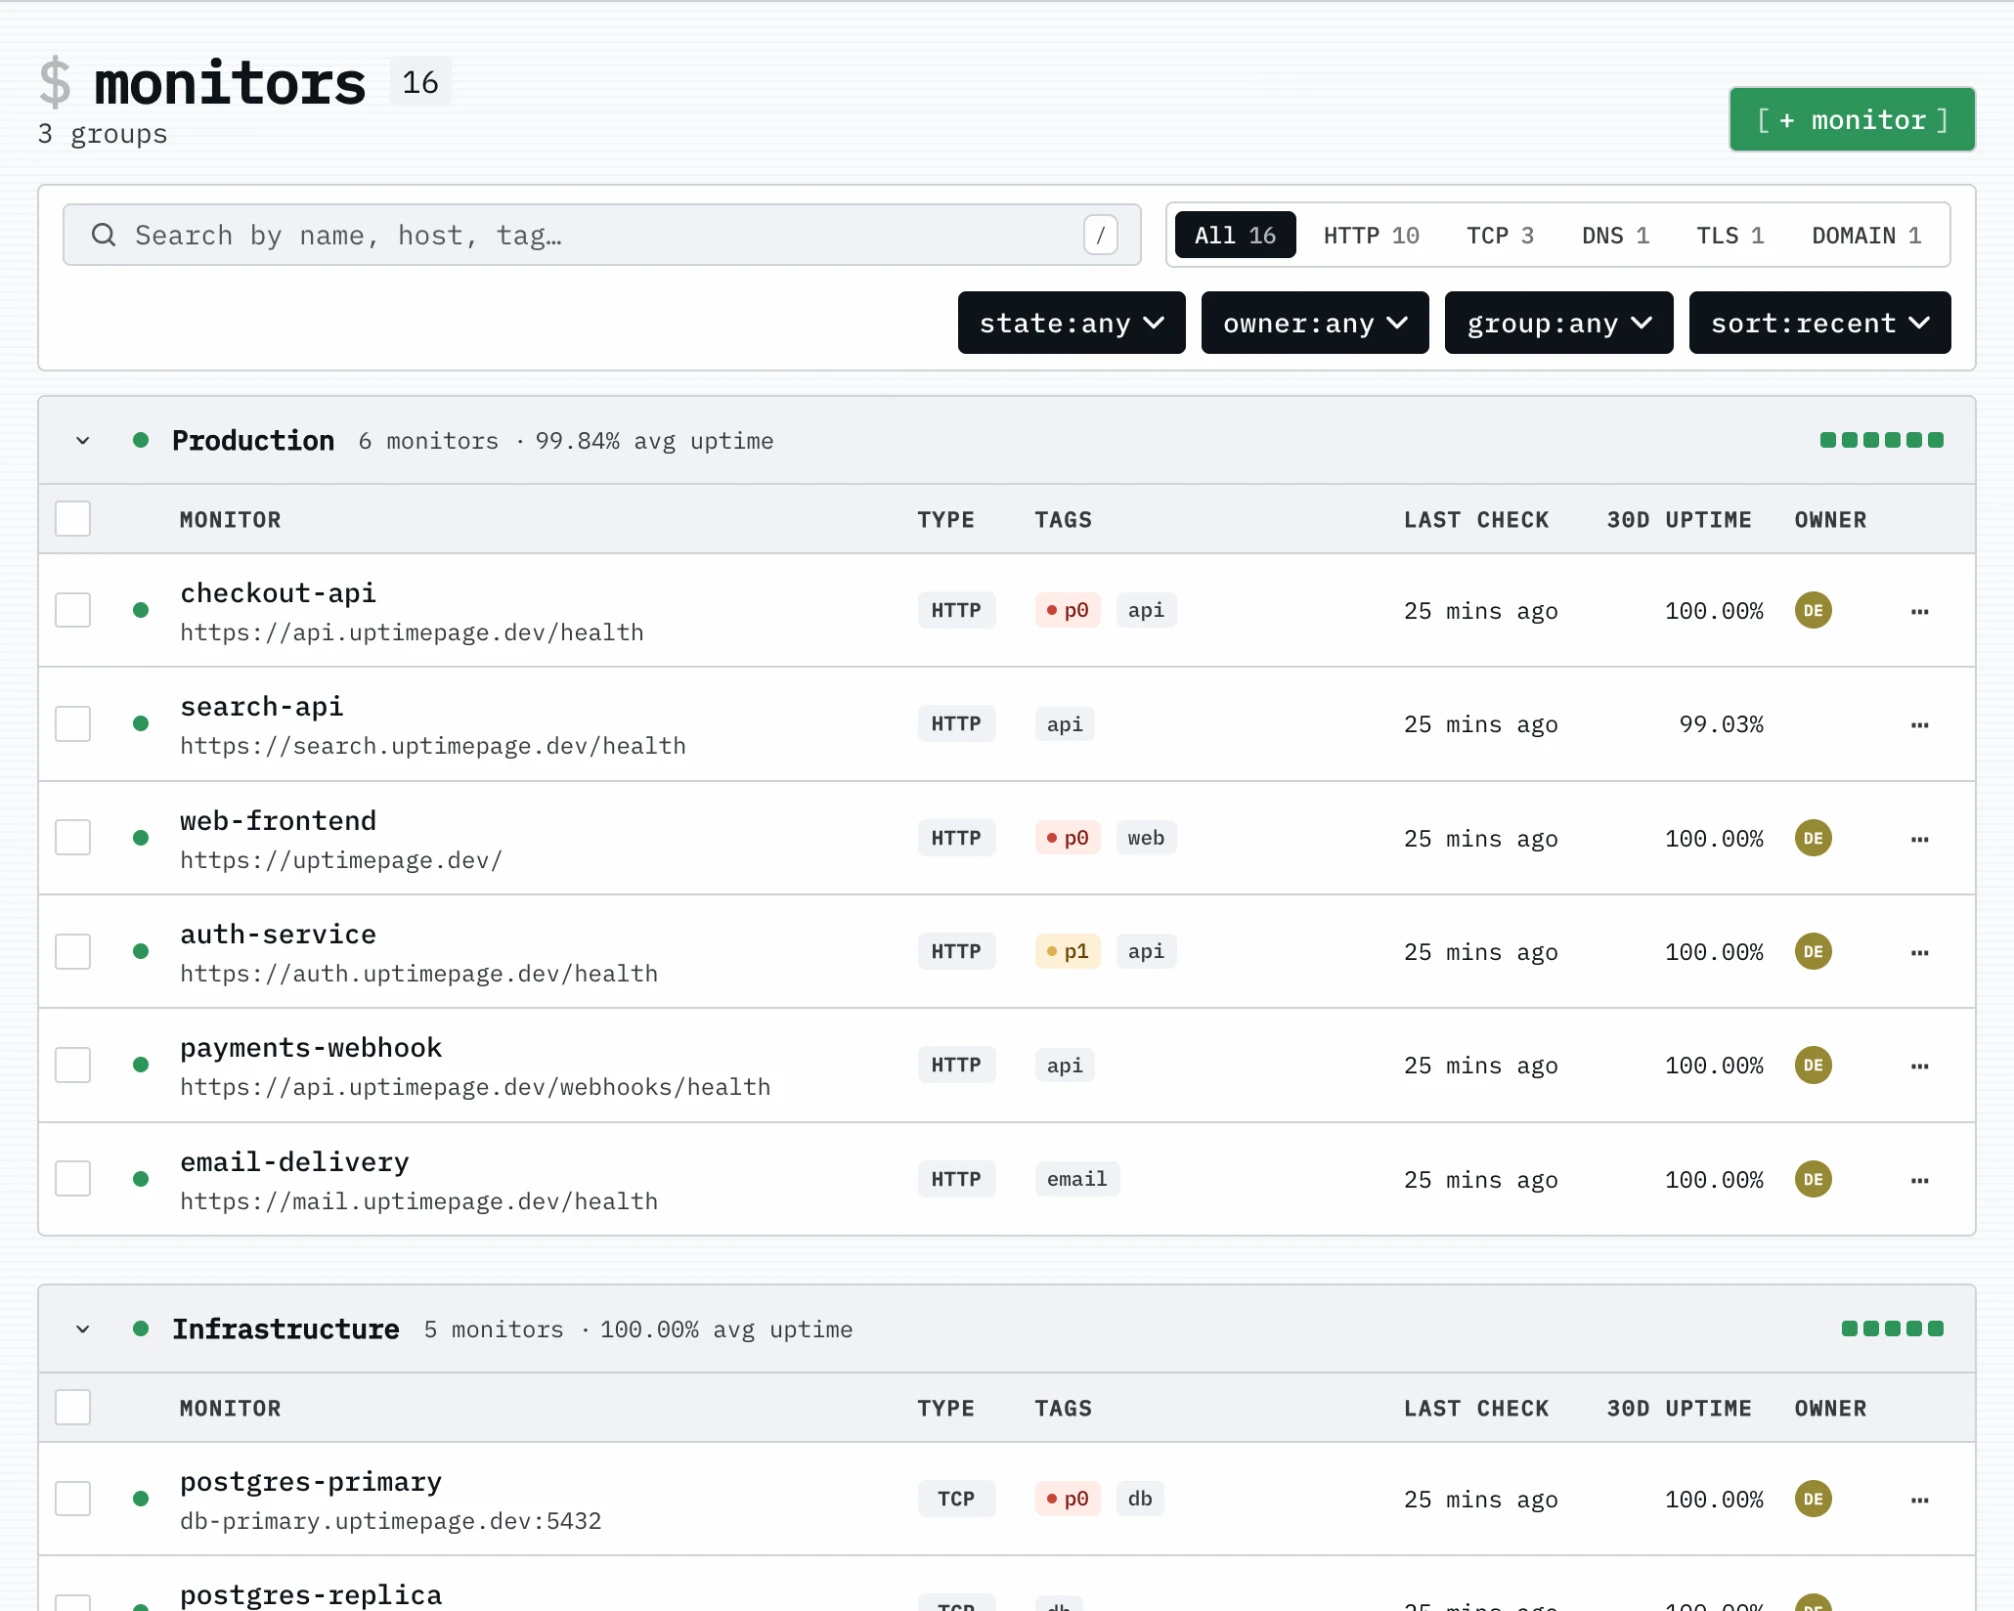
Monitors — grouped by environment, filterable by type, tag, or owner
Check types
| Type | Purpose | Default interval | Floor |
|---|---|---|---|
http | request a URL, match status / body / latency | 60 s | max(plan_min, 10 s) |
tcp | open a TCP socket within a timeout | 60 s | max(plan_min, 10 s) |
ping | ICMP echo request, fail on a missing reply | 60 s | max(plan_min, 10 s) |
heartbeat | your job pings a URL; a missing ping past period + grace opens an incident | 60 s | max(plan_min, 60 s) |
dns | resolve a record, optionally match a value | 60 s | max(plan_min, 10 s) |
tls_cert | open TLS, parse leaf cert, alert before notAfter | 86 400 s (daily) | max(plan_min, 3600 s) |
domain_expiry | query RDAP, alert before the domain's expiration event | 86 400 s (daily) | max(plan_min, 43 200 s) |
flow | drive a headless browser through login / transaction steps, assert the result | 300 s | max(plan_min, 300 s) |
manual | no probe; an operator sets up, degraded or down and it restates that state | 60 s | exactly 60 s |
tls_cert and domain_expiry use warn_days / critical_days thresholds and surface days_remaining plus registrar / cert subject in the result payload. Their floors are 1 hour for tls_cert and 12 hours for domain_expiry, regardless of plan — these probes track values that change on a scale of days, not minutes, and RDAP rate-limits by source address. flow runs a real browser, so it only executes where a browser engine is available (its regions clamp to the flow-capable set) and the number of flow monitors is capped per plan; put credentials in an org secret and reference them as {{name}}. Every flow run is kept with each step's outcome and duration, and the monitor page charts each step on its own scale, so a wait drifting from 200 ms to four seconds shows up long before the journey fails. A self-hosted install starts with that cap at 0; docs/monitor-types.md covers turning it on. See docs/api.md for the full payload shapes.
Public status page
A customer-facing /status page (HTML + JSON + RSS 2.0) is built into the binary. Per-target opt-in via public_status; the page's routes carry no auth extractor, so it is public wherever the binary runs, with a per-IP rate limit at the edge, caches for 10 s in-process, and degrades gracefully if ClickHouse is unreachable. Operators narrate incidents (PATCH /api/v1/incidents/{id}, POST /api/v1/incidents/{id}/updates) and schedule maintenance windows (POST /api/v1/maintenance). Visitors subscribe for email or webhook updates. See docs/public-status.md.
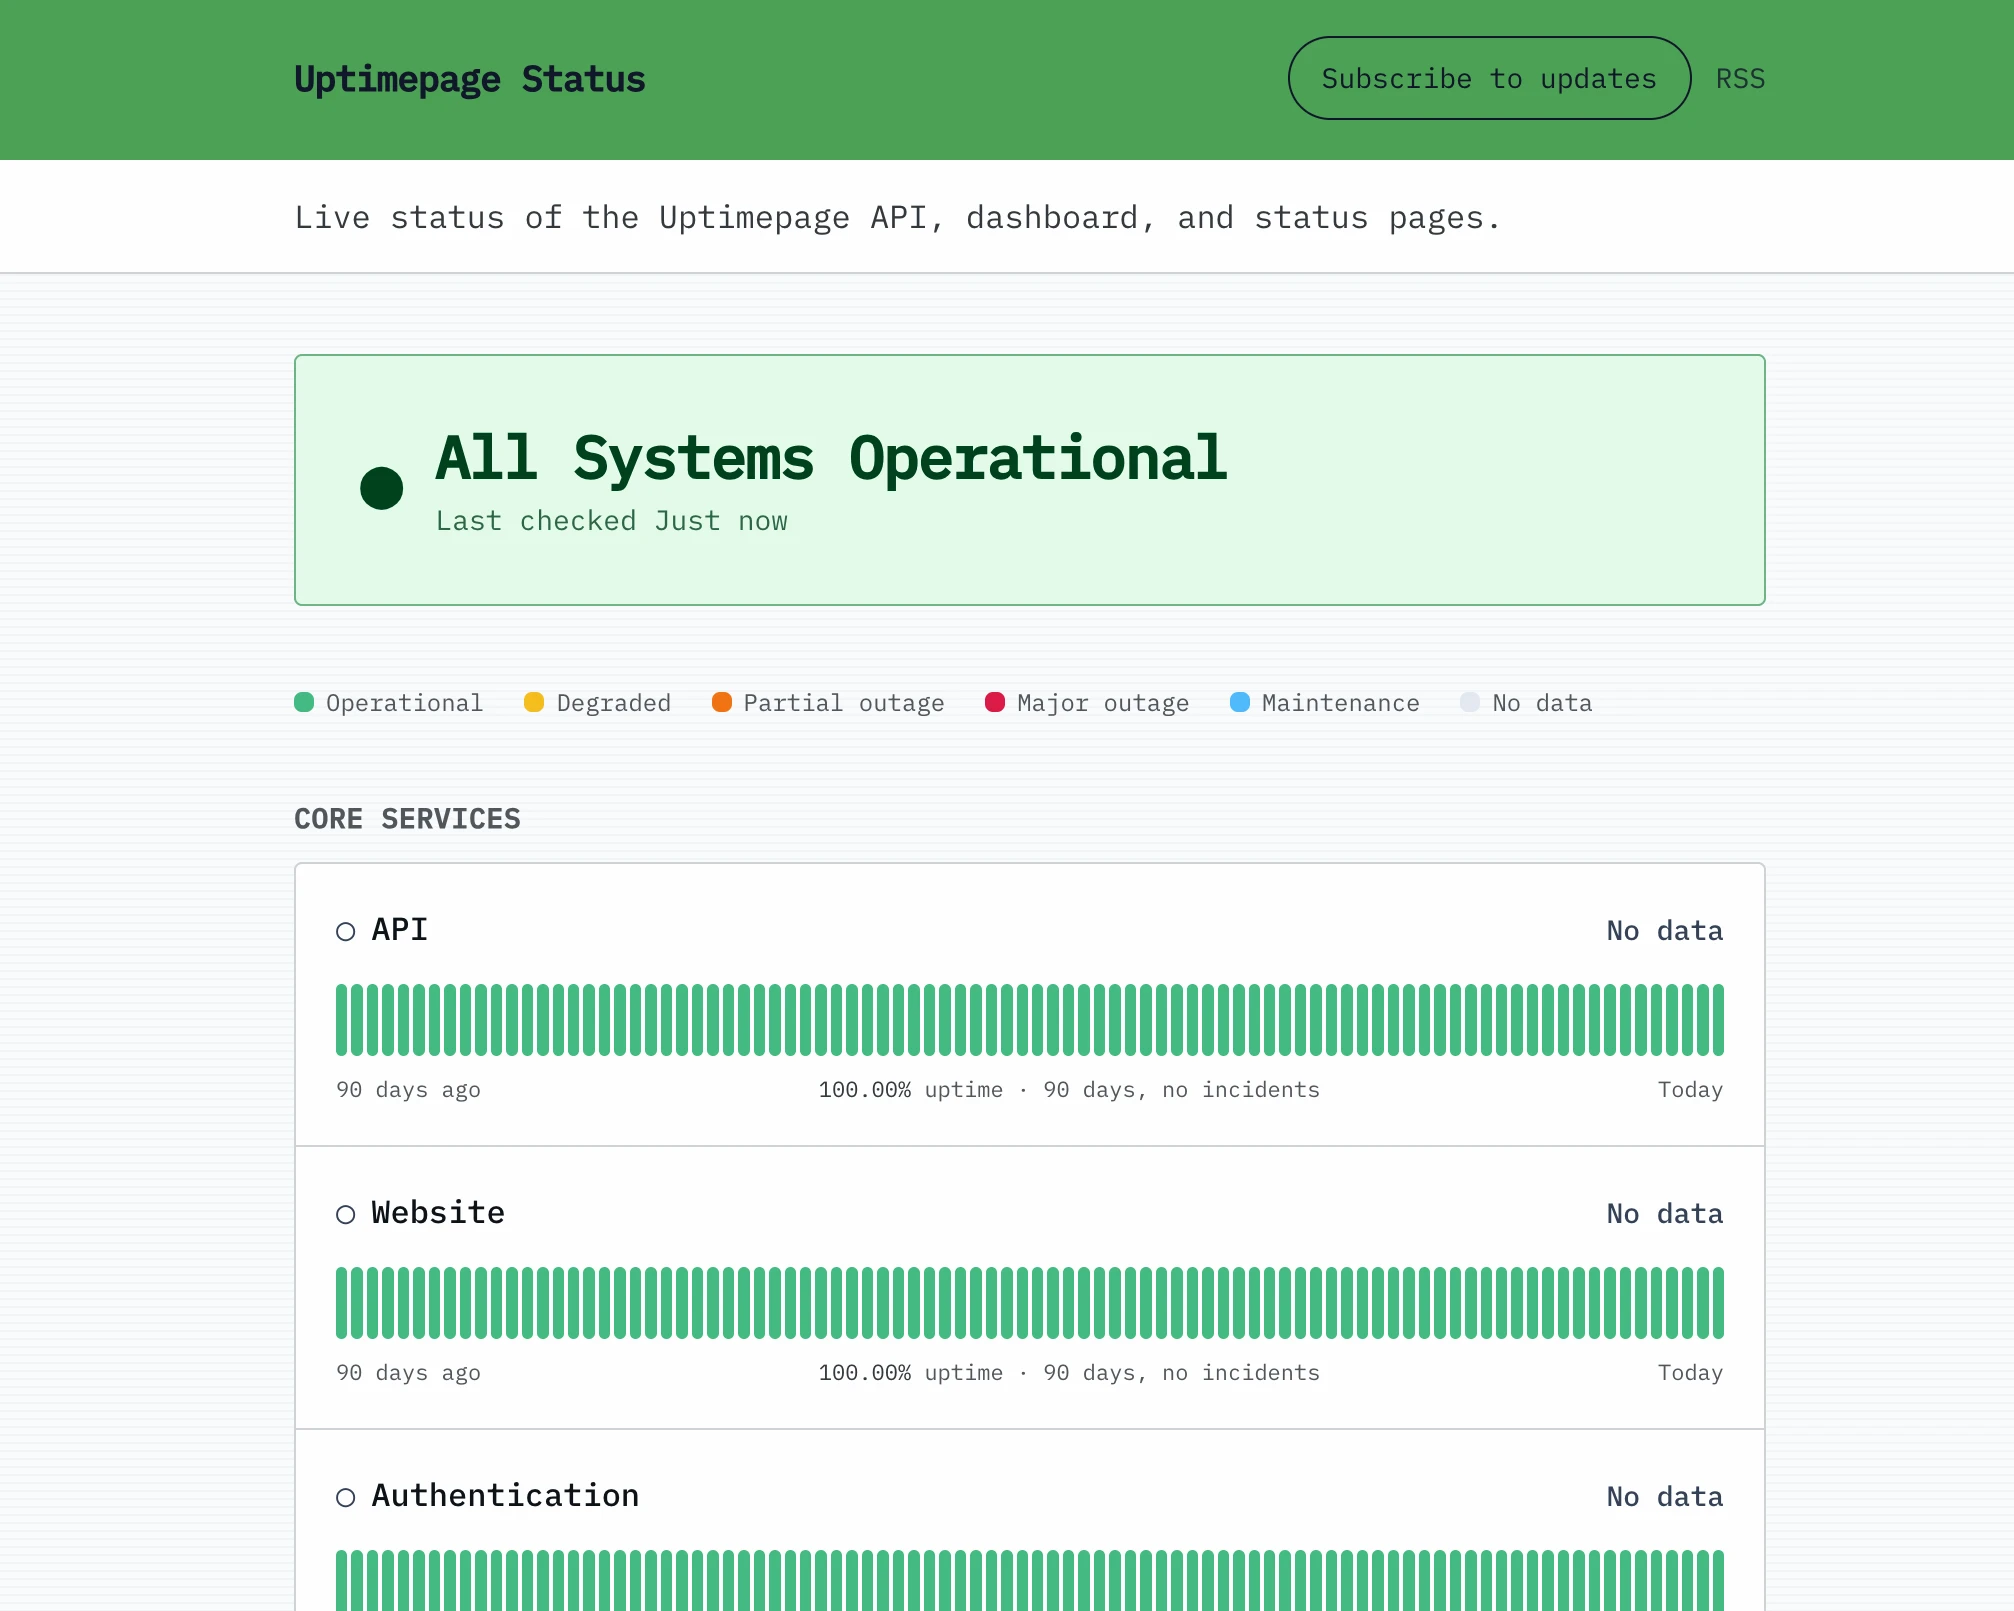
Public status page — 90 days of history per component
Alerting
Notification channels are per-org resources (Slack incoming webhook, generic
HTTP webhook, Telegram bot, SMS gateway, …) created via /api/v1/notification-channels.
Transport secrets are sealed at rest and never echoed back.
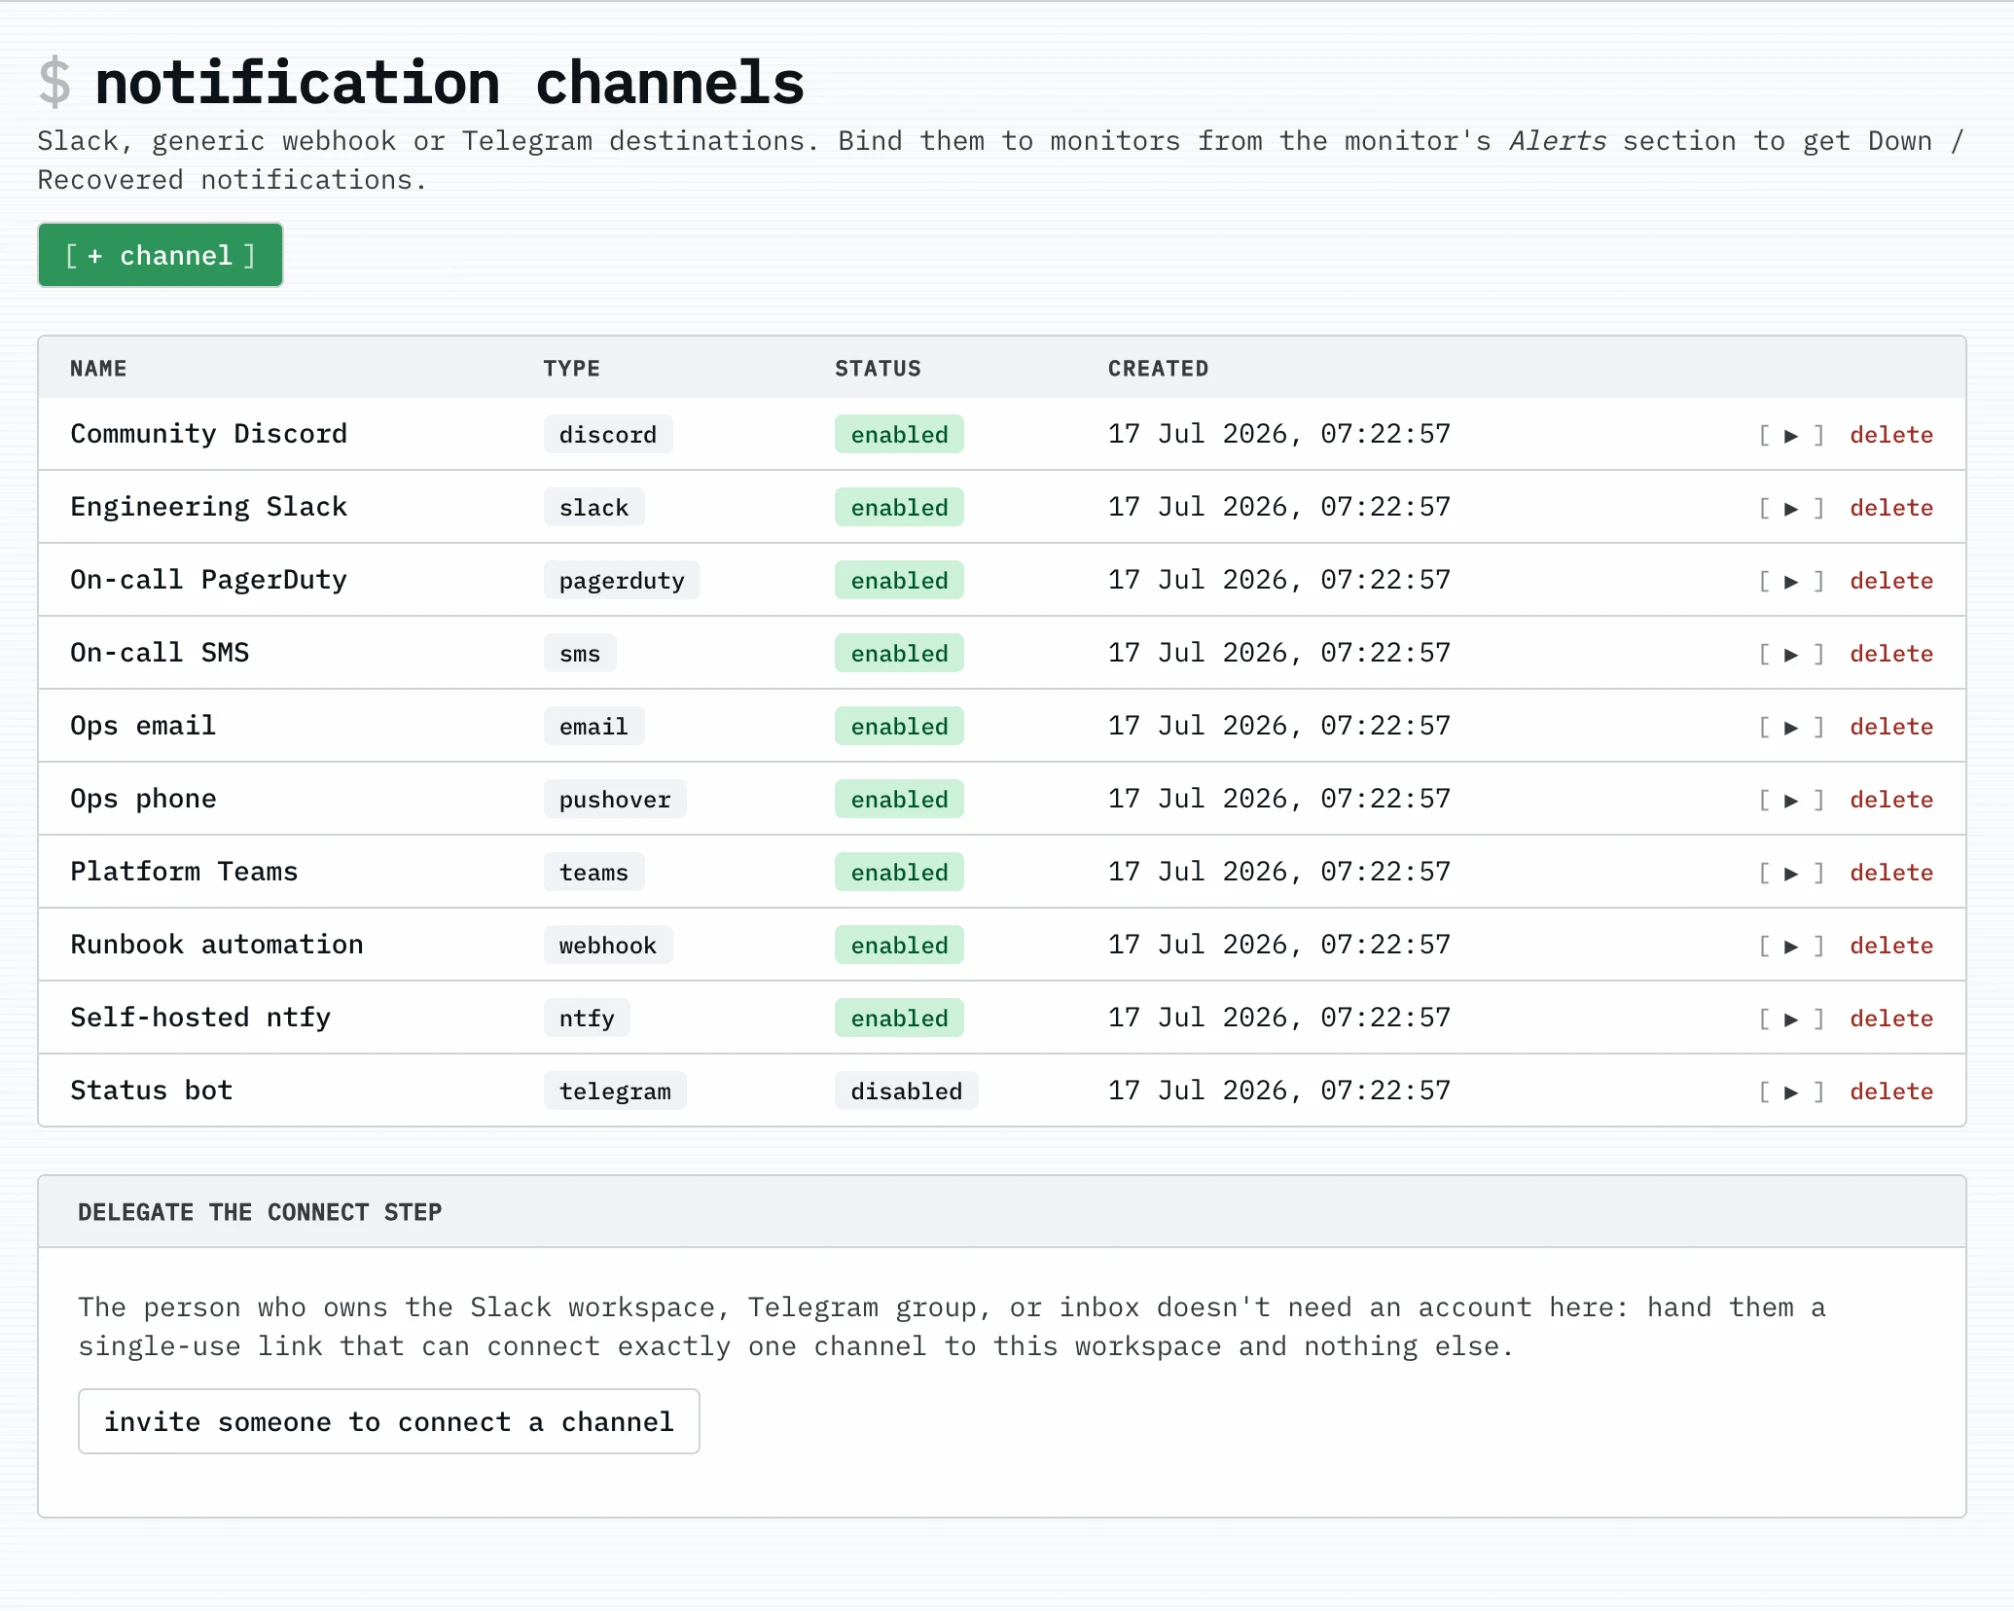
Alerting — Slack, PagerDuty, SMS, webhook, and seven more
A target opts in by binding one or more channels in its alerts array:
Fire-once + recovery semantics. Channels are tenant-isolated — a target can only bind a channel its own org owns. See docs/api.md for the full contract.
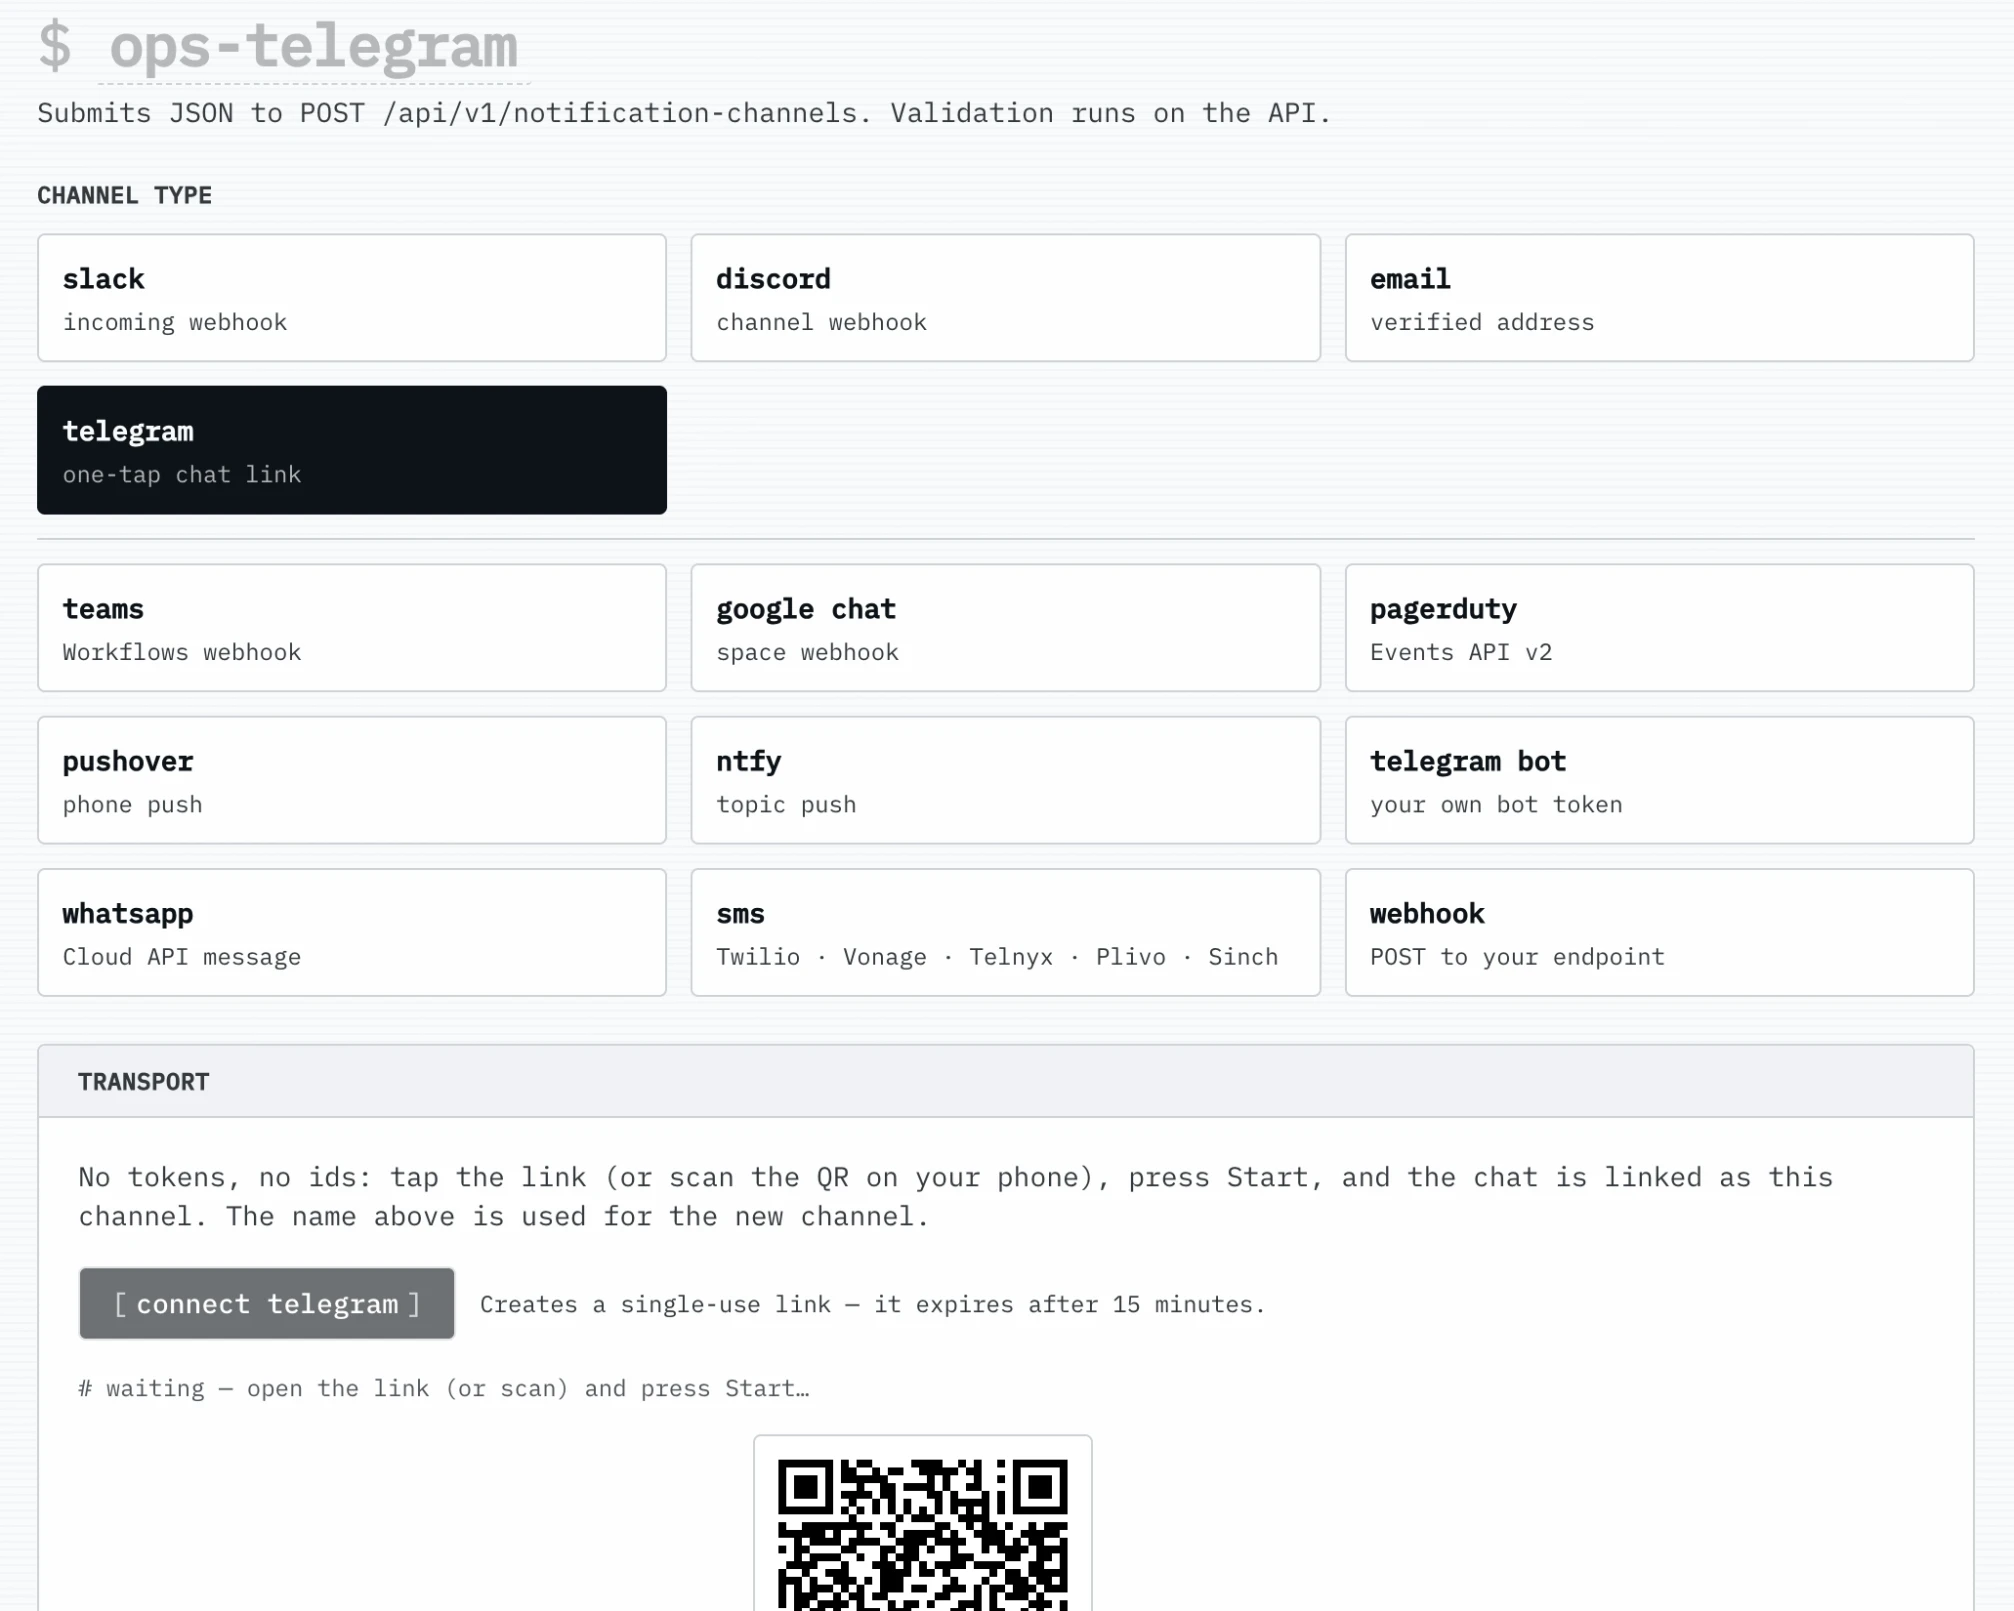
Adding a channel — pick a transport, paste one credential
Multi-region
Run probe agents in the regions your users live in; the control plane assigns checks per region and the dashboard and status page can be viewed per-region. Bring your own agent anywhere — a single binary with an org-scoped token. See docs/multi-region.md.
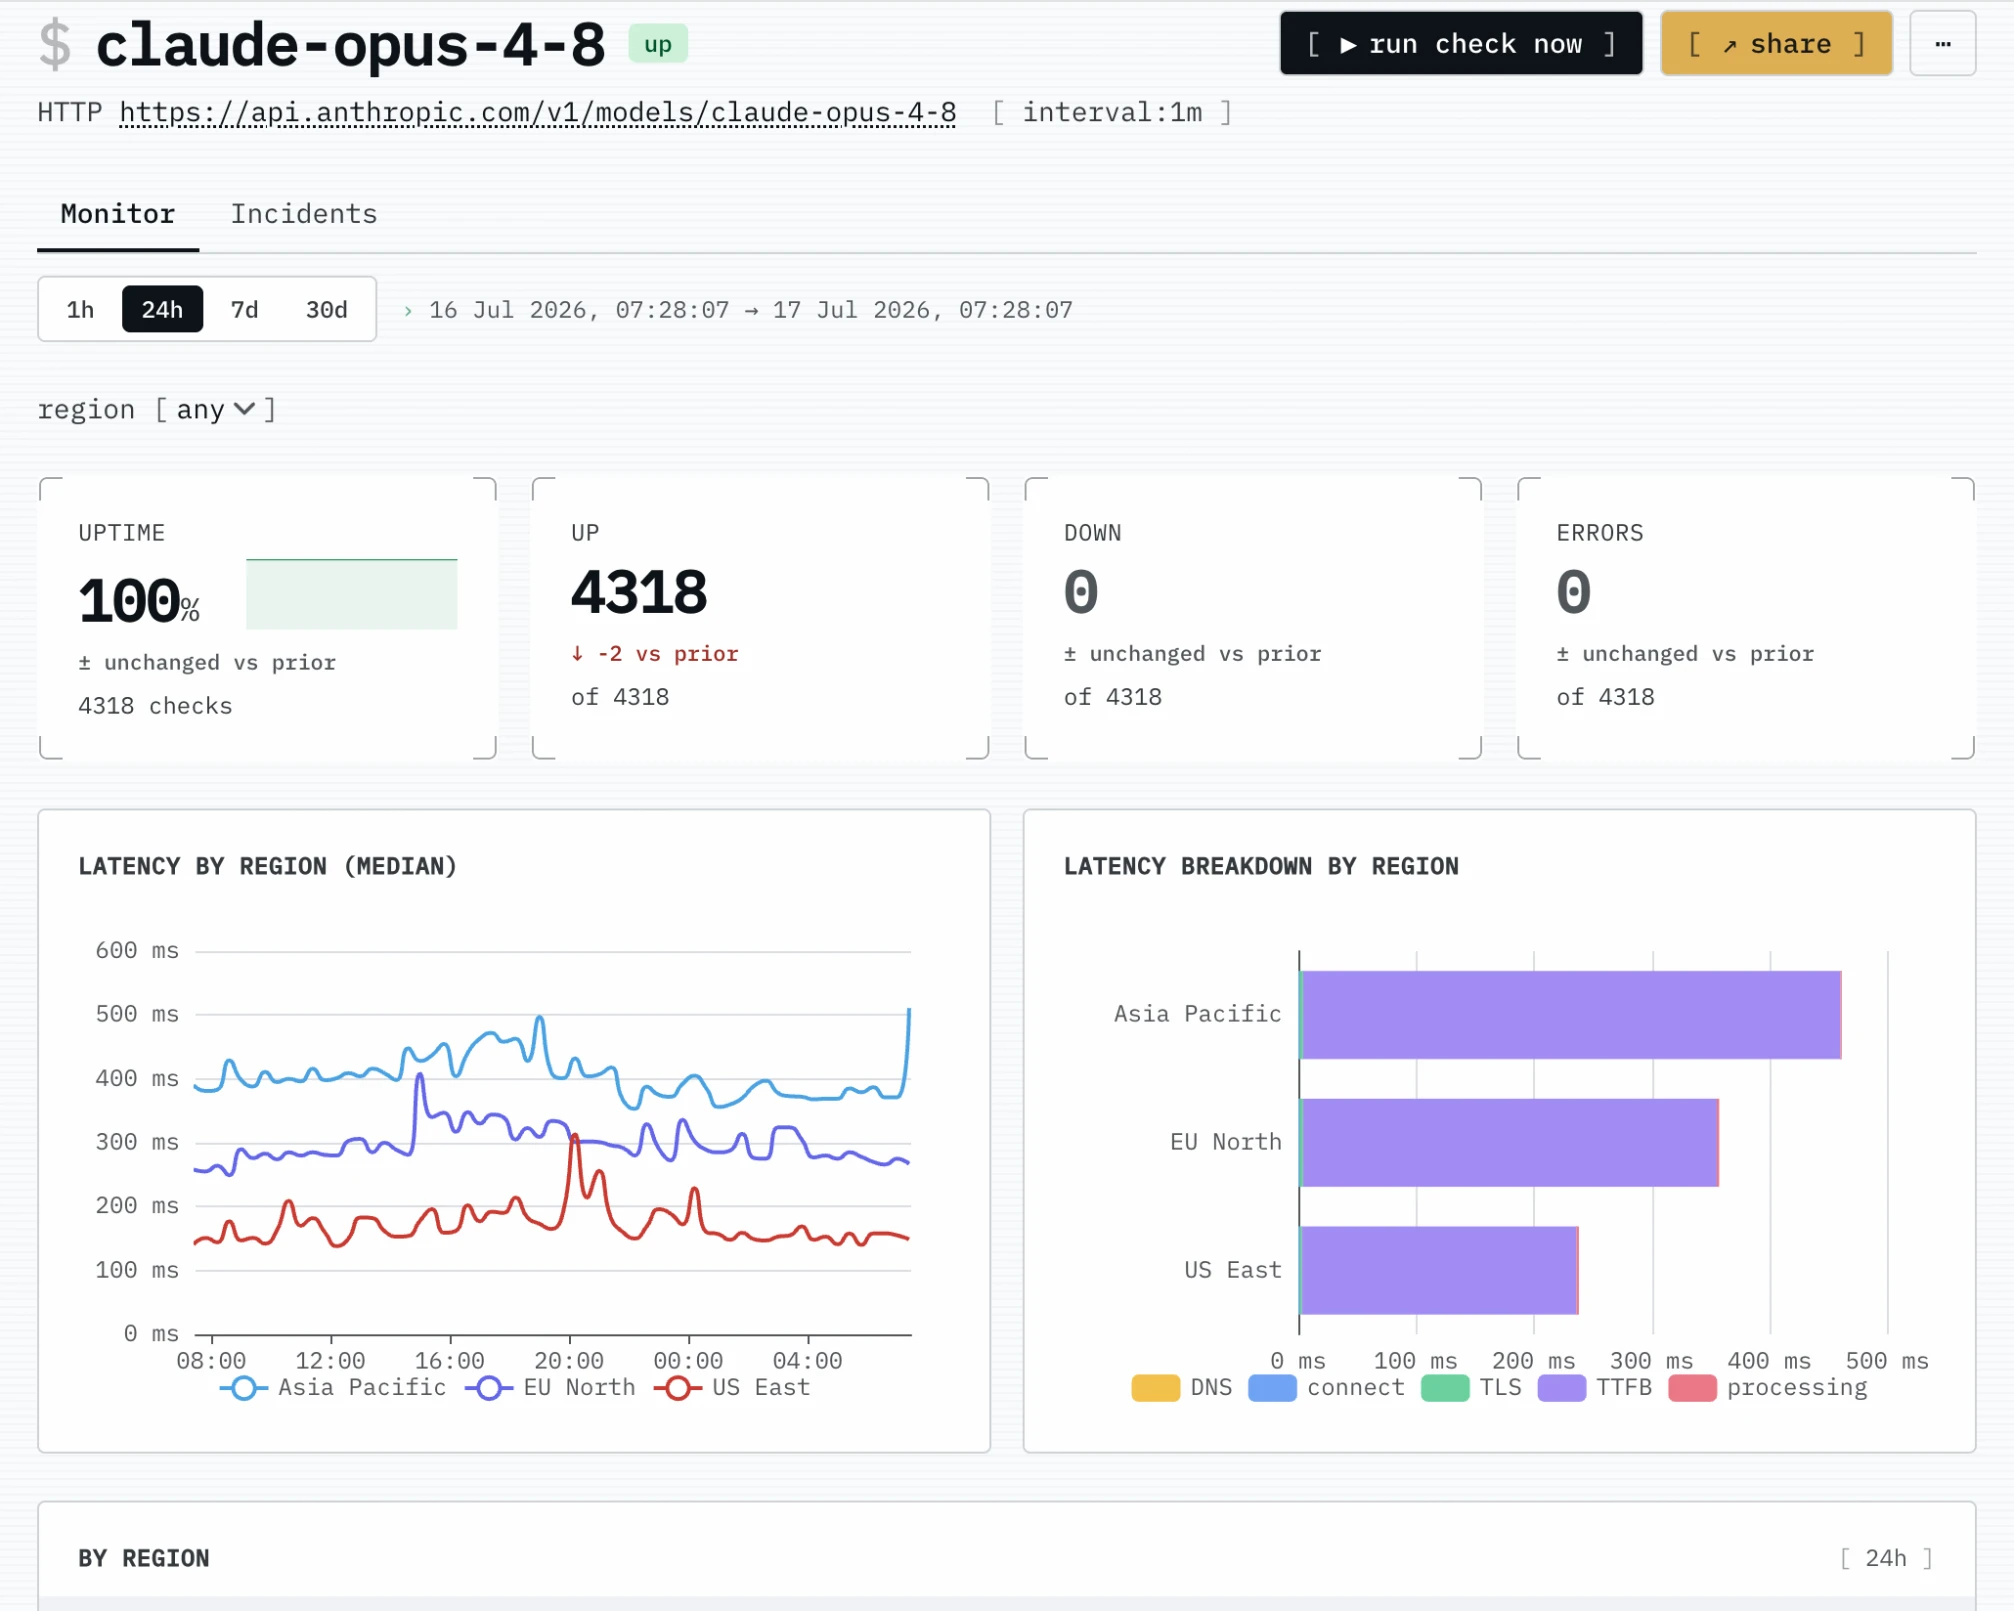
Monitor detail — latency broken down by region
Terraform
Manage targets and notification channels as code with the official provider
uptimepage/uptimepage
(source):
MCP server
An MCP server lets an LLM client (the claude.ai connector, Claude Desktop, an IDE) answer questions about one org's monitors and take a few guarded actions, over Streamable HTTP at /mcp. Eighteen read-only tools plus nineteen write tools (each scope-gated and audited, and confirmed per action where the client can show a prompt). Auth is an org-bound scoped token — paste one by hand, or use the one-click OAuth 2.1 connector. Off by default; enable with UPTIMEPAGE_MCP_ENABLED=true (+ MCP_OAUTH_ENABLED for the connector). See docs/mcp.md.
Self-host
| I want to | Go to |
|---|---|
| Try it with one command | Docker |
| Run it for real, with TLS and auth | Production deployment |
| Build the image myself (ARM host, or code changes) | Build from source |
| Skip Docker and run the binary | Run without Docker |
Docker (recommended)
Three steps. No Rust toolchain and no compile step.
1. Start it
Pulls ghcr.io/uptimepage/uptimepage:latest and starts Postgres 18, ClickHouse 26.3, and the monitor. Both databases run their own migrations at startup, so there is nothing to wire up.
2. Create your account
Prints a one-time sign-in link, a full-access API token, and your org slug. These appear once, so copy them before closing the terminal.
3. Sign in and add a monitor
Open the link from step 2. That drops you into the dashboard at http://localhost:8080, where you can add your first monitor.
To stop: docker compose down, or docker compose down -v to delete the data too.
This stack has no TLS and no auth in front of it, and it publishes the database ports. Great for trying it out, not safe on the open internet. To run it for real, see Production deployment.
Options
Pin a version. Set UPTIMEPAGE_IMAGE=ghcr.io/uptimepage/uptimepage:1.3.0 to stay on a release instead of latest. Release tags carry no v prefix, though the git tag they are built from does.
On an ARM host? Release tags are linux/amd64 and linux/arm64. latest, which tracks the newest commit on main, is amd64 only, so pin a release on ARM.
Signing in later. The bootstrap link works once. For repeat sign-in, and to invite a team, set up OAuth with GitHub, GitLab, Google or Microsoft, or an email provider for magic links ([auth.github], [auth.gitlab], [auth.google], [auth.microsoft], [email] in config/default.toml, or the matching env vars). See docs/authentication.md.
Packaging this for an app store? Step 2 needs a terminal. Set UPTIMEPAGE_BOOTSTRAP__EMAIL instead and the first boot seeds that owner and logs a sign-in link, no shell required. See First-run owner.
Prefer the API to the dashboard?
Use the token and org slug from step 2. Create a monitor:
interval is in seconds and has to meet the plan minimum, which is 180 on the free plan the bootstrap-owner step above starts you on. Anything lower returns 422 MIN_CHECK_INTERVAL. Seeding the owner at first boot instead (see First-run owner) places that org on quotas.default_plan, which defaults to team and a 30-second floor. An org created later through signup lands on founding while that tier is open, where the floor is 60 seconds.
Read uptime and scrape metrics:
Production deployment
Anything reachable from the internet should run this stack, not the one above. It adds a Caddy edge with automatic TLS, internal-only Postgres and ClickHouse, per-IP rate limits, and blue/green restarts. The operator host is guarded by the app's own sign-in, not by an edge credential. It pulls the same published image. Setup runbook is in deployment/README.md, with the architecture in docs/deployment.md.
Kubernetes
Bring your own Postgres 18 and ClickHouse; the chart ships neither. A second chart, uptimepage-agent, runs a probe on its own in another region or inside a private network, against this or the hosted service. Details in docs/kubernetes.md and charts/.
Build from source
Published images are linux/amd64. Build from this checkout when you are on an ARM host (Apple silicon, Ampere), or when you are changing the code:
Same stack and the same three steps as Docker, only the image origin differs. Note that your local build then owns that image tag, so run docker compose pull when you want the published image back.
Run without Docker
Requires Postgres and ClickHouse reachable at the URLs in config/default.toml, plus a non-empty fingerprint salt (the app refuses to boot without one):
To run against the compose stack without rebuilding the container:
Docs
Hosted: https://uptimepage.dev/docs
Sources under docs/ — readable directly on GitHub too:
| File | Covers |
|---|---|
| docs/architecture.md | goals, module layout, data flow, key design choices, concurrency model |
| docs/api.md | REST endpoints, check-spec payload shapes, result + uptime queries |
| docs/public-status.md | operator guide to the public /status page: components, incidents, maintenance |
| docs/authentication.md | sign-in, sessions, scoped API tokens, org binding |
| docs/multi-region.md | regional probe agents, the operator surface, running an agent, per-region views |
| docs/mcp.md | MCP server for LLM clients: tools, scopes, OAuth connector, enabling, examples |
| docs/configuration.md | default.toml reference, env override scheme, tuning notes |
| docs/metrics.md | Prometheus series (incl. connect / TLS / pool gauges), OpenTelemetry tracing |
| docs/deployment.md | Docker, bind addresses, migrations, sizing, graceful shutdown |
| docs/development.md | local dev workflow, the web UI (stack, routes, adding a page, tests), faster builds |
| docs/loadtest.md | bin/loadtest envs, macOS gotchas, HTTP/1 vs h2c trade-off, Linux container path |
| docs/benchmarks.md | Criterion micro-benchmarks, single-core throughput, profile breakdown |
| docs/troubleshooting.md | common failures and how to read them off metrics |
Web UI
The single binary serves both the /api/v1/* JSON surface and a server-rendered HTML UI at / — askama compile-time templates, HTMX for partial swaps and JSON forms (no SPA framework), Tailwind CSS 4, and lazy-loaded ECharts. Every UI mutation hits an existing /api/v1/* endpoint, so the API stays the single source of truth. Stack, routes, the add-a-page recipe, and UI tests are in docs/development.md.
Legal
A running instance serves its policies at /terms, /privacy, /cookies,
/impressum, /abuse-policy, /security-policy, and an RFC 9116
/.well-known/security.txt. The source documents are in
docs/legal/. GDPR self-service (data export, account
deletion, recovery) lives under /settings/account.
License
uptimepage is licensed under AGPL-3.0. See LICENSING.md for what this means in practice.
If you'd like to contribute, see CONTRIBUTING.md. For security disclosures, see SECURITY.md.