MCP Grafana
Search & edit Grafana dashboards, query datasources (PromQL/LogQL/SQL), inspect alerts.
Install MCP Grafana
Pick your client, then add it in one click or paste the config.
~/Library/Application Support/Claude/claude_desktop_config.json{
"mcpServers": {
"mcp-grafana": {
"command": "npx",
"args": [
"-y",
"@dockndevai/mcp-grafana"
]
}
}
}
Settings → Developer → Edit Config, merge this into mcpServers, then fully quit and reopen Claude Desktop.
We couldn’t confirm it starts correctly
The install command installed and started the server, which then stopped for configuration (such as an API key) that our sandbox does not have — expected for servers that connect to your account.
npx -y @dockndevai/mcp-grafanaNo response to initialize.
This is an experimental automated check and can have false negatives — missing environment variables, a slow cold install, etc. It doesn’t necessarily mean something’s wrong. Last checked 4d ago.
Overview
Security & health
What it can reach and how reliably it runs — from our own checks, not the maintainer’s claims.
Recent health check succeeded.
Supply-chain signal
No high-severity advisories surfaced by our automated scan.
Scanned 5h ago via OSV.dev · @dockndevai/mcp-grafana (npm)
Adoption & maintenance
Factual signals from GitHub, npm, and our automated checks — not a rating.
From the project README
mcp-grafana


A safe-by-default Model Context Protocol server for Grafana. It lets an agent explore and operate Grafana — search dashboards, read the dashboard JSON model, list and query datasources (Prometheus / Loki / SQL), inspect alert rules and annotations, and (in higher modes) create/update dashboards and folders, write annotations, and delete.
Part of the dockndevai MCP server suite — one governance model across all of them.

What it gives an agent
The server starts read-only (see Safe by default); higher-capability tools are only registered when you raise the mode.
| Tool | For | Needs mode |
|---|---|---|
get_health | check the instance is up, version | read-only |
search | find dashboards & folders by name/tag (get UIDs) | read-only |
list_dashboards / list_folders | enumerate dashboards / folders | read-only |
get_dashboard | the full dashboard JSON model + meta | read-only |
list_datasources / get_datasource | datasources (secrets redacted) | read-only |
query_datasource | run PromQL / LogQL / SQL via the unified query API | read-only |
list_alert_rules | Grafana-managed alert rules | read-only |
list_annotations | events overlaid on graphs | read-only |
create_or_update_dashboard | upsert a dashboard (versioned, reversible) | read-write |
create_folder | create a folder | read-write |
create_annotation | mark a deploy/incident on graphs | read-write |
delete_dashboard / delete_folder / delete_annotation | delete (irreversible) | admin + GRAFANA_ALLOW_DELETE |
Install
npx -y @dockndevai/mcp-grafana
You need a Grafana service account token (Administration → Service accounts → Add service account → Add token). Give it the least role that works — Viewer for read-only use, Editor to create/update, Admin only if you must delete.
Configure
{
  "mcpServers": {
    "grafana": {
      "command": "npx",
      "args": ["-y", "@dockndevai/mcp-grafana"],
      "env": {
        "GRAFANA_URL": "http://localhost:3000",
        "GRAFANA_TOKEN": "glsa_...",
        "GRAFANA_MODE": "read-only"
      }
    }
  }
}
See docs/CLIENTS.md for Claude Code / Cursor / Codex / VS Code / Windsurf snippets, and .env.example for every supported variable.
Safe by default
The access model is enforced by src/security.ts — defence in depth on top of the service-account token's own role:
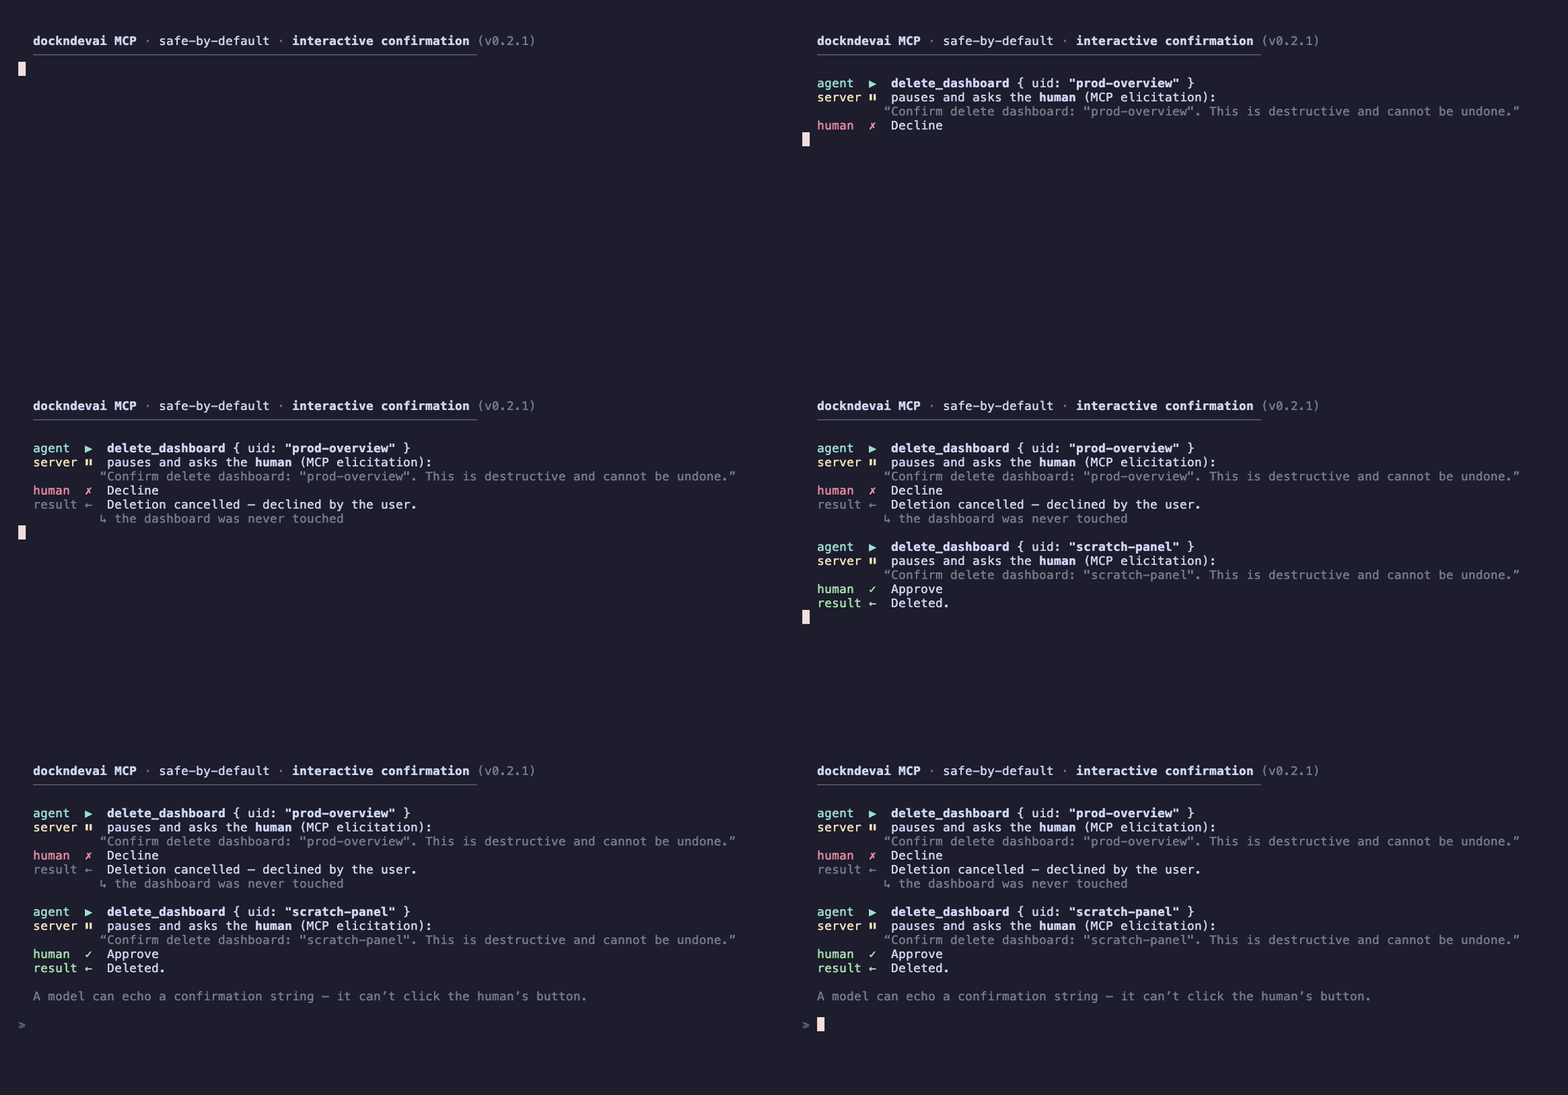
GRAFANA_MODE—read-only(default) →read-write→admin. A tool is registered only if the mode allows its capability. Read-only exposes the 11 read tools; edits needread-write; deletes needadmin.GRAFANA_ALLOW_DELETE— deletes are irreversible, so on top ofadminmode they also require this flag.GRAFANA_FOLDER_ALLOWLIST/GRAFANA_PROTECTED_FOLDERS— confine which folders can be written to; mark folders (e.g.production) that may be read but never modified or deleted.GRAFANA_DATASOURCE_ALLOWLIST— restrict which datasourcesquery_datasourcemay hit.GRAFANA_DRY_RUN— validate and log writes without executing them.GRAFANA_AUDIT_LOG— a JSON audit line per guarded operation, on stderr (default on).- Interactive confirmation — when the client supports MCP elicitation, deleting a dashboard/folder/annotation prompts the human to approve before it runs; clients that can't elicit fall back to the
GRAFANA_ALLOW_DELETEgate. - Secrets are never returned — datasource
secureJsonData, passwords and tokens are stripped from every response.
See SECURITY.md.
Working with dashboards & queries
Conventions for the dashboard JSON model, panel/target shapes, PromQL/LogQL/SQL query patterns, folder organisation and safe editing live in the bundled skill: .claude/skills/grafana-dashboards-and-queries/SKILL.md. Agents that load it can build and edit dashboards to a consistent standard without being re-taught each time.
Developing
npm install
npm run build
GRAFANA_URL=http://localhost:3000 GRAFANA_TOKEN=glsa_… node dist/index.js
# introspect without a live Grafana:
echo '{"jsonrpc":"2.0","id":1,"method":"tools/list","params":{}}' | GRAFANA_TOKEN=x node dist/index.js
Licence
MIT
Reviews
No reviews yet — be the first to share how it worked for you.
Frequently Asked Questions about MCP Grafana
Related MCP servers
Add a badge to your READMEShow it’s listed — live SVG, Markdown or HTML.
AllMCPs Directory Badge
Showcase your server listing on GitHub or your project documentation. Embed this dynamic SVG badge to highlight official listing status and live engagement.
[](https://allmcps.com/mcp/mcp-grafana)<a href="https://allmcps.com/mcp/mcp-grafana"><img src="https://allmcps.com/api/badge/mcp-grafana?style=directory" alt="MCP Grafana on AllMCPs" /></a>