visual-studioroslyndebuggingrefactoringdotnet
Visual Studio MCP AI Server exposing Roslyn and debugger tools for semantic code navigation, refactoring, build, test, and debugging.
Quick Install
Automated & IDE SetupCopy the AI prompt to install this server into Claude Code, Cursor, or another agent — or use 1-click editor setup below.
Not yet automatically verified
We haven't yet run this listing's install command through our automated sandbox check. This isn't a red flag — we're steadily working through the catalog.
Manual Client & Custom JSON ConfigExpand JSON ▾
Client Config & Setup
Choose your client or environment
Target File:
💡 Paste the JSON block into your client's configuration file under mcpServers, then restart the application.
Overview
Use cases
Find symbol definitions and references with compiler accuracy
Perform safe renaming of symbols across a solution
Generate inheritance trees and call graphs for code analysis
Run builds and tests with structured diagnostics
Control and inspect .NET debugging sessions programmatically
Key features
Semantic code navigation and symbol search powered by Roslyn
Safe rename refactoring verified by the compiler
Build and test execution with real-time status
Runtime debugging tools including breakpoints, stepping, and variable inspection
Support for Docker, WSL, and SSH debugging transports
Solution and project structure introspection
Capabilities & Tool Schemas
Inspect callable tools, capabilities, and parameters exposed to AI agents by MCP AI Server Visual Studio.
Extracted Tool Capabilities
Semantic code navigation and symbol search powered by Roslyn
Safe rename refactoring verified by the compiler
Build and test execution with real-time status
Runtime debugging tools including breakpoints, stepping, and variable inspection
Support for Docker, WSL, and SSH debugging transports
Solution and project structure introspection
Documentation Overview
MCP AI Server for Visual Studio
Other tools read your files. MCP AI Server understands your code.


The first and only Visual Studio extension that gives AI assistants access to the C# compiler (Roslyn) and the Visual Studio Debugger through the Model Context Protocol. 41 tools. 13 powered by Roslyn. 19 debugging tools (Preview). Semantic understanding, not text matching.
Install
Install from Visual Studio Marketplace
Or search for "MCP AI Server" in Visual Studio Extensions Manager.
See it in Action
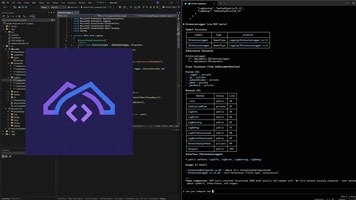
Click to watch on YouTube
Why MCP AI Server?
AI coding tools (Claude Code, Codex CLI, Gemini CLI, OpenCode, Cursor, Copilot, Windsurf...) operate at the filesystem level — they read text, run grep, execute builds. They don't understand your code the way Visual Studio does.
MCP AI Server bridges this gap by exposing IntelliSense-level intelligence and the Visual Studio Debugger as MCP tools. Your AI assistant gets the same semantic understanding that powers F12 (Go to Definition), Shift+F12 (Find All References), safe refactoring — and now runtime debugging.
What becomes possible:
| You ask | Without MCP AI Server | With MCP AI Server |
|---|---|---|
| "Find WhisperFactory" | grep returns 47 matches | Class, Whisper.net, line 16 — one exact answer |
| "Rename ProcessDocument" | sed breaks ProcessDocumentAsync | Roslyn renames 23 call sites safely |
| "What implements IDocumentService?" | Impossible via grep | Full inheritance tree with interfaces |
| "What calls AuthenticateUser?" | Text matches, can't tell direction | Precise call graph: callers + callees |
| "Why is ProcessOrder returning null?" | Reads code, guesses | Sets breakpoint, inspects actual runtime values |
22 Stable Tools
Semantic Navigation (Roslyn-powered)
| Tool | Description |
|---|---|
FindSymbols | Find classes, methods, properties by name — semantic, not text |
FindSymbolDefinition | Go to definition (F12 equivalent) |
FindSymbolUsages | Find all references, compiler-verified (Shift+F12 equivalent) |
GetSymbolAtLocation | Identify the symbol at a specific line and column |
GetDocumentOutline | Semantic structure: classes, methods, properties, fields |
Code Understanding (Roslyn-powered)
| Tool | Description |
|---|---|
GetInheritance | Full type hierarchy: base types, derived types, interfaces |
GetMethodCallers | Which methods call this method (call graph UP) |
GetMethodCalls | Which methods this method calls (call graph DOWN) |
Code Analysis (Roslyn-powered)
| Tool | Description |
|---|---|
GetDiagnostics | Compiler errors & warnings without building — Roslyn background analysis |
Refactoring (Roslyn-powered)
| Tool | Description |
|---|---|
RenameSymbol | Safe rename across the entire solution — compiler-verified |
FormatDocument | Visual Studio's native code formatter |
Project & Build
| Tool | Description |
|---|---|
ExecuteCommand | Build or clean solution/project with structured diagnostics |
ExecuteAsyncTest | Run tests asynchronously with real-time status |
GetSolutionTree | Solution and project structure |
GetProjectReferences | Project dependency graph |
LoadSolution | Open a .sln/.slnx file — server stays on the same port |
TranslatePath | Convert paths between Windows and WSL formats |
Editor Integration
| Tool | Description |
|---|---|
GetActiveFile | Current file and cursor position |
GetSelection / CheckSelection | Read active text selection |
GetLoggingStatus / SetLogLevel | Extension diagnostics |
19 Debugging Tools (Preview)
Your AI assistant can now debug your .NET code at runtime through the Visual Studio Debugger. Set breakpoints, step through code, inspect variables, attach to Docker containers and WSL processes.
Debug Control (10 tools)
| Tool | Description |
|---|---|
debug_start | Start debugging (F5). Fire-and-forget |
debug_stop | Stop debugging session |
debug_get_mode | Current mode: Design, Running, or Break |
debug_break | Pause the running application |
debug_continue | Resume execution |
debug_step | Step over/into/out |
immediate_execute | Execute expression with side effects |
debug_list_transports | List transports (Default, Docker, WSL, SSH...) |
debug_list_processes | List processes on a transport |
debug_attach | Attach to a running process |
Debug Inspection (5 tools)
| Tool | Description |
|---|---|
debug_get_callstack | Call stack of current thread |
debug_get_locals | Local variables (tree-navigable) |
debug_evaluate | Evaluate expression / drill into variable tree |
output_read | Read VS Output window (Build, Debug, Tests) |
error_list_get | Errors and warnings from VS Error List |
Breakpoint Management (4 tools)
| Tool | Description |
|---|---|
breakpoint_set | Set breakpoint by file+line or function name |
breakpoint_remove | Remove breakpoint |
breakpoint_list | List all breakpoints |
exception_settings_set | Configure break-on-exception |
AI Debugging Guide
Complete reference for AI agents — all 19 tools, 10 workflows, Docker & WSL setup, polling patterns, and best practices.
Download AI Debugging Guide (.md) — add it to your AI's context for full debugging capabilities.
Compatible Clients
Works with any MCP-compatible AI tool:
CLI Agents:
- Claude Code — Anthropic's terminal AI coding agent
- Codex CLI — OpenAI's terminal coding agent
- Gemini CLI — Google's open-source terminal agent
- OpenCode — Open-source AI coding agent (45k+ GitHub stars)
- Goose — Block's open-source AI agent
- Aider — AI pair programming in terminal
Desktop & IDE:
- Claude Desktop — Anthropic's desktop app
- Cursor — AI-first code editor
- Windsurf — Codeium's AI IDE
- VS Code + Copilot — GitHub Copilot with MCP
- Cline — VS Code extension
- Continue — Open-source AI assistant
Any MCP client — open protocol, universal compatibility
Quick Start
- Install from Visual Studio Marketplace
- Open your .NET solution in Visual Studio
- Configure port in MCP Server Settings (default: 3010)
- Add to your MCP client:
- Start asking your AI semantic questions about your code
MCP Client Configuration
| AI Tool | Type | Config File |
|---|---|---|
| Claude Code | CLI | CLAUDE.md |
| Claude Desktop | App | claude_desktop_config.json |
| Cursor | IDE | .cursor/rules/*.mdc or .cursorrules |
| Windsurf | IDE | .windsurfrules |
| Cline | VS Code Extension | .clinerules/ directory |
| VS Code + Copilot | IDE | .github/copilot-instructions.md |
| Continue | IDE Extension | .continue/config.json |
| Gemini CLI | CLI | GEMINI.md |
| OpenAI Codex CLI | CLI | AGENTS.md |
| Goose | CLI | .goose/config.yaml |
Any tool supporting Model Context Protocol will work.
Configure AI Preferences (Recommended)
Add these instructions to your project's AI config file (see table above) to ensure your AI automatically prefers MCP tools:
Multi-Solution: Understand Your Dependencies
Need the AI to understand a library you depend on? Clone the source from GitHub, open it in a second Visual Studio — each instance runs its own MCP server on a configurable port.
Your AI connects to all of them. It can trace calls, find usage patterns, and understand inheritance across your code and library code.
MCP client configuration — three options depending on your client:
Related MCP Servers
Adoption & maintenance
Factual signals from GitHub, npm, and our automated checks — not a rating.
GitHub stars
47
Stargazers on the source repository.
Last commit
6mo ago
Most recent push to the default branch.
Directory activity
1 views
Config copies, upvotes, and views on AllMCPs.
Reviews
No reviews yet — be the first to share how this listing worked for you.
Frequently Asked Questions about MCP AI Server Visual Studio
AllMCPs Directory Badge
Showcase your server listing on GitHub or your project documentation. Embed this dynamic SVG badge to highlight official listing status and live engagement.
Badge Style:
Live Dynamic SVG Preview
Markdown (GitHub README)
[](https://allmcps.com/mcp/ladislavsopko-mcp-ai-server-visual-studio)HTML Embed
<a href="https://allmcps.com/mcp/ladislavsopko-mcp-ai-server-visual-studio"><img src="https://allmcps.com/api/badge/ladislavsopko-mcp-ai-server-visual-studio?style=directory" alt="MCP AI Server Visual Studio on AllMCPs" /></a>