Homebutler README
The full upstream README, mirrored here for reference. Install config, tool schemas, adoption signals, and an original overview live on the Homebutler listing page.

HomeButler
Only the changes worth mentioning.
A single Go binary that remembers what your server looked like last time,
and tells you — or an agent — what moved.





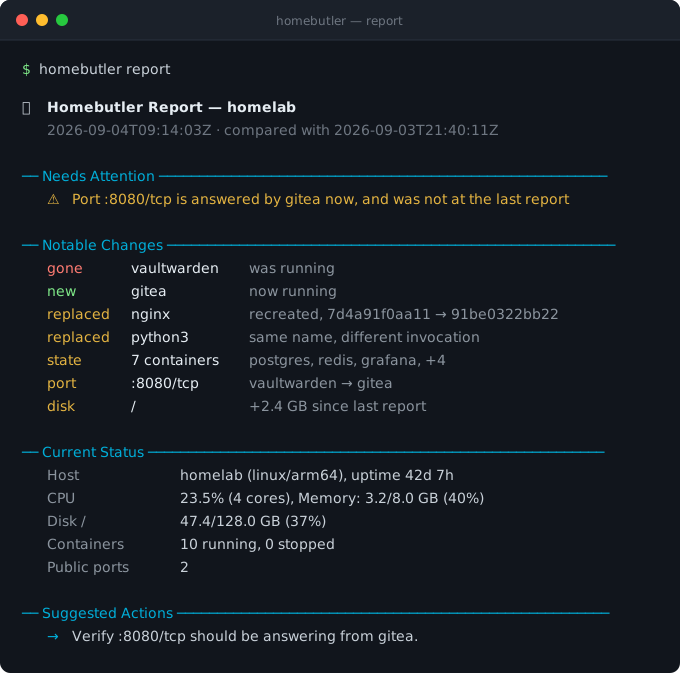
Section rules, labels, and severities are colour-coded in a terminal. Colour is dropped automatically when output is piped, redirected, or run from cron.
That is the whole idea. Most homelab tools show you a graph of right now, and leave "does this matter?" to you. HomeButler remembers what your server looked like last time, decides what is worth saying, and says it — six containers before and six after is not "no change" when one of them is a different container.
Reading a change
Every line is three columns: what kind of change, what it happened to, and
what exactly happened. The kind is one of eight words, and it is the same word in
--json, so an agent branches on it without reading prose:
| Kind | Means | You would see it after |
|---|---|---|
gone | it was there last time and is not now | docker rm, a service stopping, a port closing |
new | it was not there last time and is now | starting anything |
replaced | same name, different thing underneath | docker compose up -d — the container is recreated, so the name and the count are unchanged |
image | same container, different image | pulling a new tag |
state | same container, running where it was stopped, or the reverse | a crash, or bringing something back up |
port | same port, a different process answering on it | one service taking over another's port |
disk | a mount moved by more than half a gigabyte | anything that writes |
skipped | the comparison could not be made | Docker was down when either snapshot was taken |
replaced is the one the rest of this exists for. A container recreated under the
same name leaves every count identical, which is why a report that compares counts —
as this one did before 0.26.0 — answers "no significant changes" while the thing you
were running has been swapped out underneath you.
skipped is the second: homebutler says it could not compare rather than reporting
nothing changed. An all-clear it cannot stand behind is worse than no answer.
The header names the snapshot being compared against, so "what changed" is never ambiguous about the window it covers.
📖 What earns a line, and what is deliberately suppressed →
HomeButler helps you answer the boring but painful questions every homelab eventually creates:
- What is running on my server right now?
- Which container owns this port?
- Why did this service restart at 3 AM?
- Is my backup actually restorable?
- Can I install this self-hosted app without hand-writing another compose file?
- Can I let an AI assistant inspect my server without handing it a full SSH shell?
No daemon required. No database. No always-on web service. Just one Go binary you can use from the terminal, scripts, a web dashboard, or AI tools.
The design goal is simple: give humans and agents a narrow, structured interface to the server. HomeButler returns readable summaries and JSON instead of asking you to trust a black-box shell session.
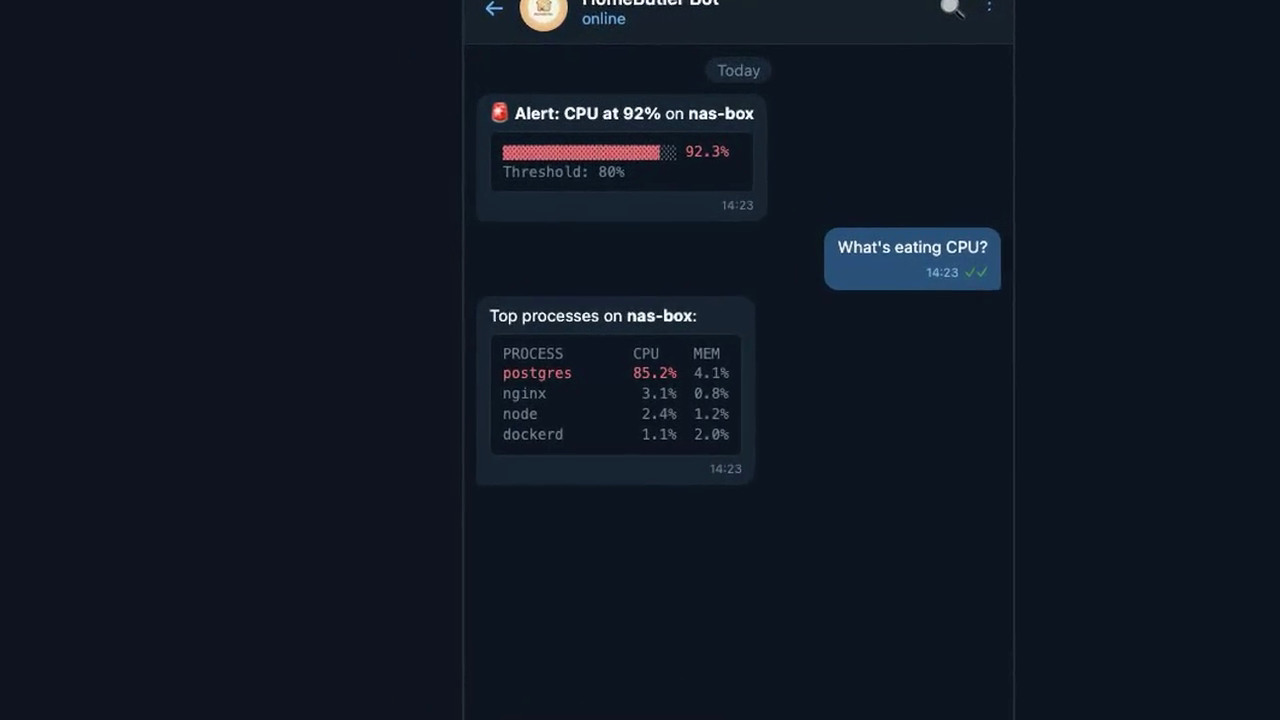
▶️ 34s demo — monitor, diagnose, and manage your homelab
Quick Start
Use it right away:
Machine-readable output is available everywhere:
What it does
- Install apps — deploy Uptime Kuma, Jellyfin, Pi-hole, Gitea, Portainer, and more with one command
- Map your server — see containers, exposed ports, system ports, and service topology
- Run a doctor check — diagnose resource pressure, stopped containers, public ports, backup hygiene, notifications, report baseline readiness, and configured Proxmox endpoint reachability
- Catch crashes — save logs before/after Docker, systemd, or PM2 restarts and detect flapping loops
- Verify backups — boot backups in isolated containers before you trust them
- See a Proxmox cluster — nodes, QEMU and LXC guests, storage, task status, and honest dashboard freshness, with power actions that name their target explicitly
- Use it anywhere — CLI, JSON, web dashboard, or MCP for AI agents without giving them SSH
Why homebutler?
Self-hosting is not hard because one docker compose up is hard. It is hard because the maintenance never ends: ports collide, containers restart silently, backups look fine until restore day, and every server becomes a slightly different snowflake.
HomeButler is a small operations toolkit for that messy middle.
Why not just use Portainer, Netdata, or CasaOS?
Those are great dashboards. HomeButler is CLI-first, scriptable, JSON-friendly, air-gap friendly, and safe to copy onto any server. Use it when you want commands you can run from a terminal, cron job, SSH session, CI script, or AI agent — especially when you care more about “what changed?” than another graph.
Core workflows
🧾 Butler Report
report gives you a concise butler-style summary of your homelab: current health, warnings, notable changes since the previous snapshot, and suggested next commands. On the first run, HomeButler creates a baseline under ~/.homebutler/reports/snapshots/; later runs compare against the latest snapshot. Old snapshots are pruned automatically (--keep 30 by default) so reports do not grow forever.
🩺 Doctor Check
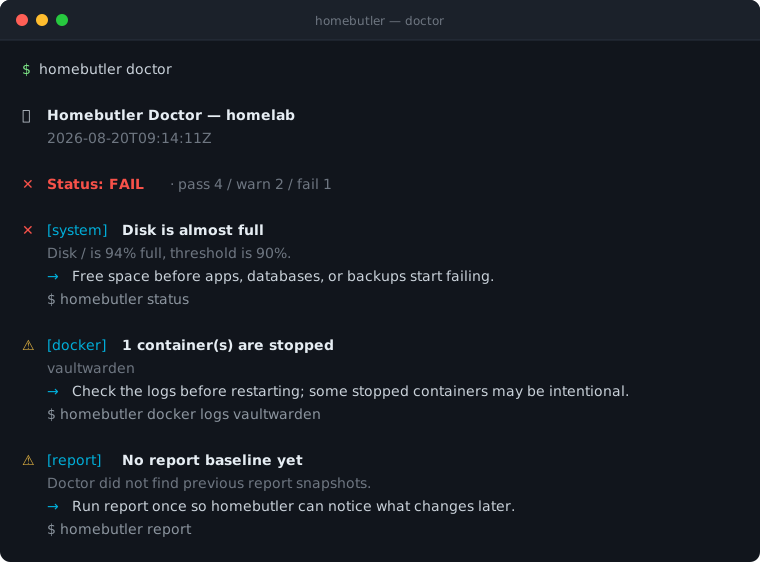
doctor is a read-only preflight for the problems homelab users usually discover too late: high disk or memory usage, stopped containers, public bind ports, stale or missing backups, missing notifications, whether report has a baseline for change detection, and whether each configured Proxmox endpoint is reachable with the token it has. Every finding names the next command to run, so --strict makes it usable from cron or CI — including a Proxmox host that is unreachable or rebooting.
🗂 Config Validation
config validate reads your config without starting anything and tells you
which file was used, which of the four resolution rules picked it, and what
homebutler actually made of each section. It exists because the two ways config
goes wrong are both silent: a key homebutler does not recognise is dropped
without a word, and a --config path that does not exist falls back to
built-in defaults rather than failing.
📦 One-Command App Install

homebutler install uptime-kuma— Deploy self-hosted apps in seconds. Pre-checks Docker, ports, and duplicates. Generatesdocker-compose.ymlautomatically. See all available apps →
🗺️ Inventory & Topology
inventory scan gives you a quick map of what is running on a server: system health, Docker containers, app ports, and system ports. Docker-published ports are connected back to the container that owns them, so local forwarding details like Colima/Lima stay understandable.
To answer "what is reachable from outside my machine/network?" without reading the whole tree, filter the scan to exposed ports only:
Only ports listening on all interfaces (0.0.0.0, ::, *) are shown. Anything bound to a specific address is hidden, including loopback and LAN addresses. Unsupported filter values return an error, as does combining --filter with --json; the default inventory scan output is unchanged.
Use Mermaid export when you want a diagram for GitHub, Obsidian, docs, or an AI assistant:
Demo
🌐 Web Dashboard
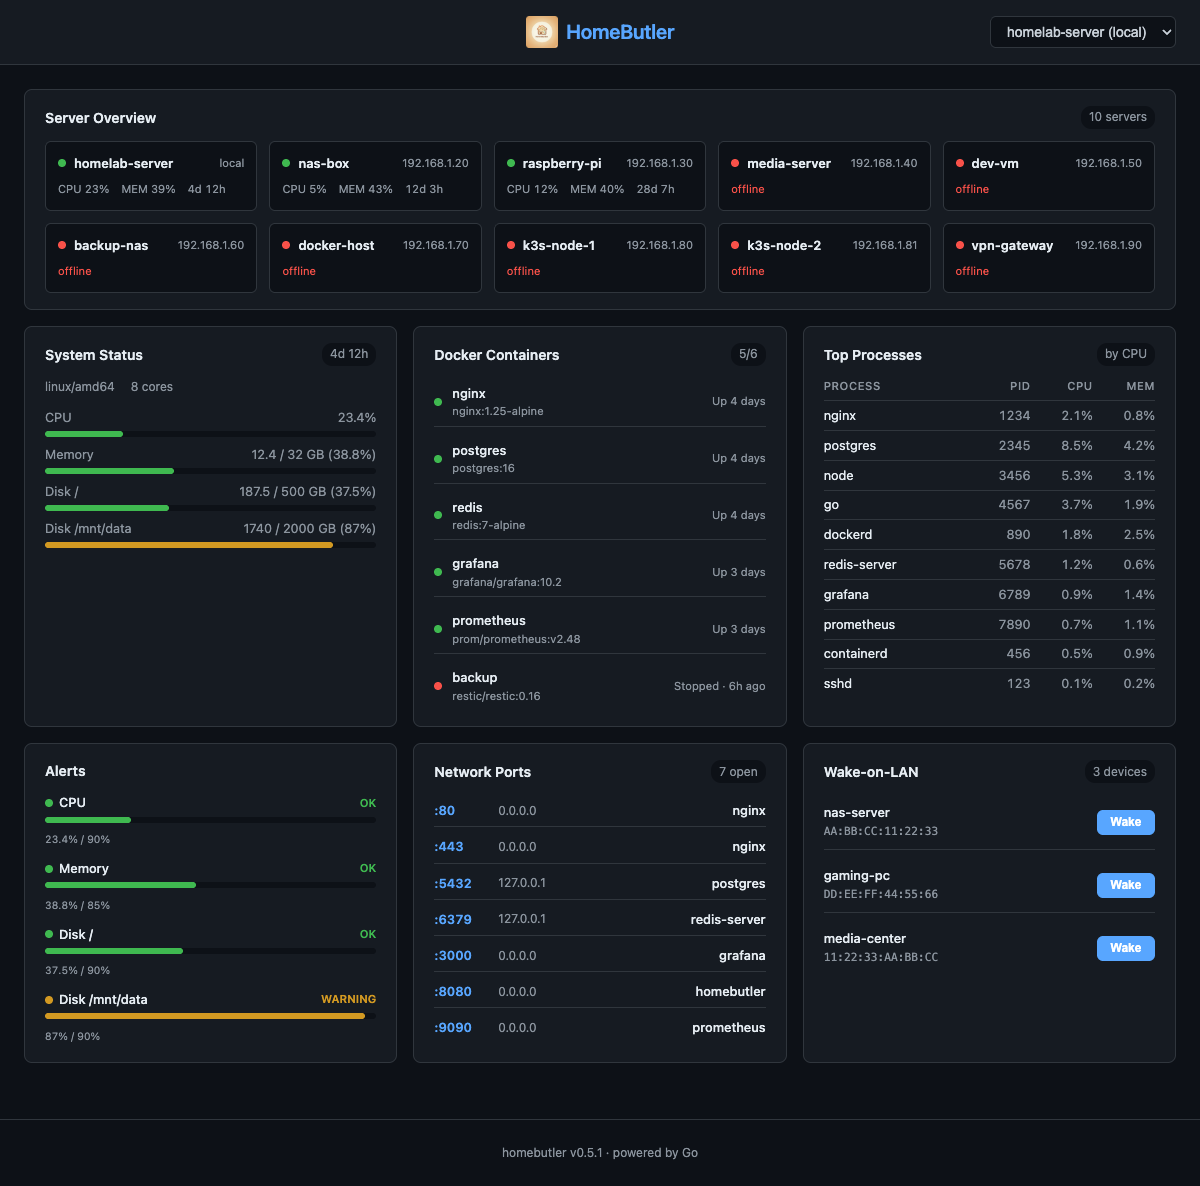
homebutler serve— A real-time web dashboard embedded in the single binary viago:embed. Monitor all your servers, Docker containers, open ports, alerts, and Wake-on-LAN devices from any browser. Dark theme, auto-refresh every 5 seconds, fully responsive.
✨ Web Dashboard Highlights
- Server Overview — See all servers at a glance with color-coded status (green = online, red = offline)
- System Metrics — CPU, memory, disk usage with progress bars and color thresholds
- Docker Containers — Running/stopped status with friendly labels ("Running · 4d", "Stopped · 6h ago")
- Top Processes — Top processes sorted by CPU/memory with zombie detection
- Resource Warnings — Visual CPU, memory, and disk thresholds in the dashboard
- Network Ports — Open ports with process names and bind addresses
- Wake-on-LAN — One-click wake buttons for configured devices
- Server Switching — Dropdown to switch between local and remote servers
- Zero dependencies — No Node.js runtime needed. Frontend is compiled into the Go binary at build time
🔄 Process Restart Watch
Your container crashed at 3 AM — but why? homebutler watch catches it the moment it happens, saves the dying logs, figures out the cause, and tells you if it's happening over and over.
Supported backends: Docker (real-time event stream) · systemd (polling) · PM2 (polling)
Step 1: Add targets to watch
Step 2: Start monitoring
watch install hands the loop to whatever supervises the host — a systemd user
unit on Linux, a launchd agent on macOS — so monitoring survives logout and
reboot. Both are user-level and neither is a preference: on Linux the watch list
lives in your home directory, so a root unit would find an empty list; on macOS
Docker Desktop only runs inside a logged-in session, so a LaunchDaemon would
poll a daemon that is not there. On Linux a user unit stops at logout unless you
run sudo loginctl enable-linger $USER, which watch install tells you.
watch start is the monitoring process. It watches the containers and services
on the watch list for restarts, checks CPU, memory and disk against your
thresholds, and runs any remediation rules you have configured — one process,
one set of notification providers. alerts --watch still exists and does the
threshold half on its own.
Every endpoint under proxmox: in your config is polled too: unreachable or
ACL-filtered endpoints and any guest listed under that endpoint's guests:
report one incident when the problem starts and one recovery incident when it
clears. A guest not listed there is observational only — watch start never
alerts on it, deliberately stopped or not. See
Proxmox setup → for the guests: field.
When a crash is detected, you'll see:
Step 3: Investigate
watch show output includes:
- Pre-death logs — what the process printed right before it died
- Post-restart logs — what happened after the restart
- Crash analysis — category (oom / panic / segfault / timeout / dependency / error), reason, confidence level, matched log patterns
- Flapping status — if the process is stuck in a crash loop
Crash Analysis
Every incident is automatically analyzed using exit codes and log patterns:
| Signal | Exit Code | Meaning |
|---|---|---|
| SIGKILL | 137 | OOM Killer or forced kill |
| SIGSEGV | 139 | Segmentation fault (memory corruption) |
| SIGTERM | 143 | Graceful shutdown request |
| — | 1 | Application error |
| — | 0 | Clean exit (may be intentional restart) |
Log patterns like panic:, Out of memory, Connection refused, FATAL, and timeout are matched automatically to help identify the root cause.
Flapping Detection
Detects when a process is stuck in a restart loop (e.g., crash → restart → crash again):
- Acute — 3+ restarts within 10 minutes (something is broken right now)
- Chronic — 5+ restarts within 24 hours (slow recurring issue)
Flapping incidents are tagged [FLAPPING] in history and highlighted in watch show.
Notifications (optional, off by default)
Notifications are disabled by default, which is useful for air-gapped or closed networks where everything runs locally.
A minimal example in ~/.config/homebutler/config.yaml:
Restarting things that are not containers
action: restart restarts Docker containers unless the rule says otherwise.
kind: systemd or kind: pm2 points it at a service or a PM2 app instead.
The kind is written on the rule rather than looked up from the watch list, so
restarting a host service is something you asked for in the config. It also
means every rule written before kind existed keeps meaning exactly what it
meant.
Two things worth knowing before using it:
systemctl restart needs root or a polkit rule. Running homebutler
unprivileged, a systemd restart will be refused, reported as failed, and
warned about when alerts --watch starts rather than when the rule first
fires.
A target that is flapping is not restarted. Restarting something already
in a restart loop feeds the loop, and most systemd units carry
Restart=always, so homebutler restarting them fights systemd's own backoff.
The thresholds are the watch.flapping ones above, and the skip is reported
rather than counted as either success or failure. This applies to Docker
targets too.
Legacy ~/.homebutler/watch/config.json is still read as a fallback for watch-specific settings, and legacy alerts.yaml notify/webhook provider settings are still accepted for older setups.
-
watch.enabled: true— allow watch notifications -
watch.notify_on: flapping— notify only when repeated restart loops are detected -
watch.notify_on: incident— notify on every incident -
watch.notify_on: all— notify on both incidents and flapping -
watch.notify_on: off— disable watch notifications without removing provider config -
watch.cooldown: 5m— suppress duplicate notifications for the same event fingerprint during the cooldown window -
watch.flapping— optional advanced tuning for restart-loop detection -
watch.retention.max_incidents: 200— how many incidents to keep on disk, newest first. The directory grows fastest exactly when a service is restarting in a loop. Set-1to keep everything.Each incident keeps up to 100 captured log lines per side, and at most 64 KB of them. Line counts alone do not bound a file: one stack trace or JSON document on a single line is arbitrarily long, and a container being OOM-killed is exactly the one likely to write one. A log that does not fit keeps its end — the last thing a process said is what explains why it stopped — and says how much was dropped.
These settings can also be written under a watch.notify: block, which is the
canonical form:
Both spellings are read, so either layout works. If a file contains both, the
notify: block wins and homebutler config validate says so.
Manage targets
🧊 Proxmox VE
A Proxmox endpoint is its own kind of target, configured under proxmox: with an
API token rather than SSH, so it does not join the --server or --all fan-out.
TLS verification stays on: trust comes from a pinned SHA-256 fingerprint, then a
CA file, and only then an explicit insecure fallback.
Reads are plain. Power actions are not: every one of them takes an explicit
endpoint, node, guest type and VMID, and refuses to run without --confirm,
which is checked before any credential is read. They also need their own
action_token_id (plus action_token or action_token_file) configured on
the endpoint — the read token alone will not start, reboot, or shut down a
guest; see Proxmox setup → for creating that second token.
shutdown asks the guest to shut down cleanly — it is not Proxmox's hard
stop, which cuts power and can leave a filesystem behind it. A successful
action reports the task it submitted, not that the guest finished; proxmox task answers that separately.
proxmox script prints the install command for a Community Script pinned to one
commit, along with a warning that the script is not reviewed by homebutler and
runs as root. It never fetches or runs it — see #62
for why that line is where it is.
📖 Proxmox setup, tokens, and TLS →
🖥️ TUI Dashboard

homebutler watch tui— A terminal-based dashboard powered by Bubble Tea. Monitors all configured servers with real-time updates, color-coded resource bars, and Docker container status. No browser needed.
🧠 AI-Powered Management (MCP)
Use natural language when you want automation. MCP clients can call homebutler tools to check server status, list Docker containers, inspect ports, or run operational workflows. See screenshots & setup →
App Install
Deploy self-hosted apps with a single command. Each app runs via docker compose with automatic pre-checks, health verification, and clean lifecycle management.
How it works
- Pre-checks — Verifies docker is installed/running, port is available, no duplicate containers
- Compose-based — Each app gets its own
docker-compose.ymlyou can inspect and customize - Data safety —
uninstallstops containers but keeps your data;purgeremoves everything - Cross-platform — Auto-detects docker socket (default, colima, podman)
Available apps
| App | Default Port | Description | Notes |
|---|---|---|---|
uptime-kuma | 3001 | Self-hosted monitoring tool | |
plex | 32400 | Plex Media Server | --media /path to mount media dir |
vaultwarden | 8080 | Bitwarden-compatible password manager | |
filebrowser | 8081 | Web-based file manager | |
it-tools | 8082 | Developer utilities (JSON, Base64, Hash, etc.) | |
gitea | 3002 | Lightweight self-hosted Git service | |
jellyfin | 8096 | Media system (movies, TV, music) | --media /path to mount media dir |
homepage | 3010 | Modern homelab dashboard | |
stirling-pdf | 8083 | All-in-one PDF tool (merge, split, convert, OCR) | |
speedtest-tracker | 8084 | Internet speed test with historical graphs | |
mealie | 9925 | Recipe manager and meal planner | |
pi-hole | 8088 | DNS ad blocking | ⚠️ Uses port 53 (DNS), NET_ADMIN capability |
adguard-home | 3000 | DNS ad blocker and privacy | ⚠️ Uses port 53 (DNS) |
portainer | 9443 | Docker management GUI | ⚠️ Mounts Docker socket (HTTPS) |
nginx-proxy-manager | 81 | Reverse proxy with SSL and web UI | ⚠️ Uses ports 80/443 |
App-specific options
Safety checks
- Port conflict detection — Checks if the port is already in use before install
- DNS mutual exclusion — Warns if pi-hole and adguard-home are both installed
- Docker socket warning — Alerts when an app requires Docker socket access (portainer)
- OS-specific guidance — Linux gets systemd-resolved fix, macOS gets lsof command
- Post-install tips — DNS setup, HTTPS access, default credential warnings
Want more apps? Open an issue or see Contributing.
Usage
Run homebutler --help for all commands.
📋 All Commands & Flags
🌐 Web Dashboard
homebutler serve starts an embedded web dashboard — no Node.js, no Docker, no extra dependencies.
Backup & Restore
One-command Docker backup — volumes, compose files, and env variables.
⚠️ Database services should be paused before backup for data consistency.
📖 Full backup documentation → — how it works, archive structure, security notes.
Alert Thresholds (Advanced)
alerts still exists for CPU, memory, and disk threshold checks, but it is an advanced flow and not the recommended first step for new users.
Default thresholds: CPU 90%, Memory 85%, Disk 90%. Start with watch, then add alerts only if you specifically want threshold-based checks.
🔍 Backup Drill
"Having a backup" and "being able to restore" are different things.
Backup Drill boots your backup in an isolated Docker environment and verifies the app actually responds — like a fire drill for your data.
What happens:
- Finds the latest backup archive
- Verifies archive integrity (
tarvalidation) - Creates an isolated Docker network + random port
- Boots the app from backup data
- Runs an HTTP health check
- Reports pass/fail and cleans up everything
Zero risk — runs in a completely isolated environment. Your running services are never touched.
Supports health checks for: nginx-proxy-manager, vaultwarden, uptime-kuma, pi-hole, gitea, jellyfin, plex, portainer, homepage, adguard-home.
Configuration
📖 What report compares → — what earns a line, what is deliberately suppressed, and why.
📖 Configuration details → — config file locations, watch/notify options, and advanced alert thresholds.
Multi-server
Manage multiple servers from a single machine over SSH.
📖 Multi-server setup → — SSH auth, config examples, deploy & upgrade.
MCP Server
Built-in MCP server — manage your homelab from any AI tool with natural language.
Works with Claude Desktop, ChatGPT, Cursor, Windsurf, and any MCP client.
📖 MCP server setup → — supported clients, available tools, agent skills.
Installation
Homebrew (Recommended)
Automatically installs to PATH. Works on macOS and Linux.
One-line Install
Auto-detects OS/architecture, downloads the latest release, and installs to PATH.
npm (MCP server)
Downloads the Go binary automatically. Use npx -y homebutler@latest to run without installing globally.
Go Install
Build from Source
make build-all compiles the web dashboard into the binary and needs Node
installed. make build skips it — the CLI is complete either way, and
homebutler serve then says the dashboard is missing and names the two ways
to get it.
Uninstall
Architecture
Goal: Engineers manage servers from chat — not SSH.
Alert fires → AI diagnoses → AI fixes → you get a summary on your phone.
homebutler is the tool layer in an AI ChatOps stack. It doesn't care what's above it — use any chat platform, any AI agent, or just your terminal.
Three interfaces, one core:
| Interface | Transport | Use case |
|---|---|---|
| CLI | Shell stdout/stderr | Terminal, scripts, AI agents via exec |
| MCP | JSON-RPC over stdio | Claude Desktop, ChatGPT, Cursor, any MCP client |
| Web | HTTP (go:embed) | Browser dashboard, on-demand with homebutler serve |
All three call the same internal/ packages — no code duplication.
homebutler is Layer 1. Swap Layer 2 and 3 to fit your stack:
- Terminal only →
homebutler status(no agent needed) - Claude Desktop → MCP server, Claude calls tools directly
- OpenClaw + Telegram → Agent runs CLI commands from chat
- Custom Python bot →
subprocess.run(["homebutler", "status", "--json"]) - n8n / Dify → Execute node calling homebutler CLI
No ports opened by default. CLI and MCP use stdin/stdout only. The web dashboard is opt-in (homebutler serve, binds 127.0.0.1).
Now: CLI + MCP + Web dashboard — you ask, it answers.
Goal: Full AI ChatOps — infrastructure that manages itself.
Contributing
Contributions welcome! Please open an issue first to discuss what you'd like to change. CONTRIBUTING.md covers what homebutler accepts and what a new target has to prove.
Security
Found a vulnerability? Report it privately through the Security tab rather than a public issue. SECURITY.md covers what is in scope and what to expect.