Microcharts vs Pbirb MCP
A side-by-side look at the Microcharts and Pbirb MCP MCP servers: transport, auth, tools, quality signals, and the config to install either one in Claude, Cursor, Windsurf or VS Code.
Verdict: choose Microcharts for data visualization work as a local process; choose Pbirb MCP for data visualization as a local process. You can also run both side by side in one mcpServers block.
Which MCP server should you choose?
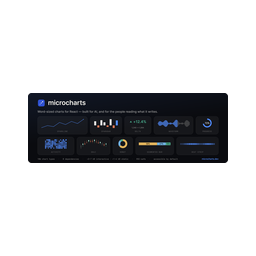 Choose Microcharts when
- You need dedicated capabilities in the Data Visualization domain.
- You prefer a local stdio subprocess transport.
- Its auth model fits you: No auth required.
- You want tools like
find_microchart, get_microchart, render_microchart.
 Choose Pbirb MCP when
- You need dedicated capabilities in the Data Visualization domain.
- You prefer a local stdio subprocess transport.
- You have the keys it needs:
PBIRB_MCP_LOG_FILE. - You want tools like
describe_report, get_datasets, list_data_sources.
Feature & specification comparison
Rows where the two servers differ are marked.
| Spec | ||
|---|---|---|
| Category | Data Visualization | Data Visualization |
| Quality signal | 68/100 · Great | 51/100 · Good |
| Install command | Confirmed | Confirmed |
| Transport | Local subprocess (stdio) | Local subprocess (stdio) |
| Auth | No auth required | Not declared |
| Pricing | Free | Not declared |
| Required env vars | None listed |
Tools & capabilities
Microcharts tools 3
find_microchartRank microcharts chart types against a plain-language question about data ("is it trending?", "error budget", "part to whole"). Returns candidates with the reason each matched. Start here when you know the question, not the chart.get_microchartFull wiring detail for one chart by slug: import paths, its props plus the shared props, data shape, best/avoid guidance, a copy-runnable example, and `sample` — the example as JSON props you can pass straight to render_microchart.render_microchartRender a chart to a finished, self-contained SVG (styles embedded) plus its generated alt text — for surfaces that can't run React. Pass the series as `data`; put other props (value, target, curve, color, width) in `props`. Each chart takes its own data shape — get_microchart returns a valid `sample` to adapt.
Pbirb MCP tools 80
describe_reportTop-level inventory: data sources, datasets, parameters, tablixes, page setupget_datasetsFull DAX command text, fields, query parameters, dataset filters (all, or one by name)list_data_sourcesData source inventory; one source's connection detailsget_parametersReport parameters with data type, prompt, and flags (multi-value, hidden, nullable, allow-blank)get_tablixesTablix layout: columns, row/column groups, sort expressions, filters, visibilitylist_tablix_filtersFilters in document order with stable indiceslist_body_itemsNamed report items in each regionget_textboxFull properties of a named report item
Ready-to-paste client configs
Paste either block (or both) into your client config, e.g. claude_desktop_config.json or ~/.cursor/mcp.json. We only show a config when the install command is confirmed.
Microcharts
{
  "mcpServers": {
    "ganapativs-microcharts": {
      "command": "npx",
      "args": [
        "-y",
        "@microcharts/mcp"
      ]
    }
  }
}
Pbirb MCP
{
  "mcpServers": {
    "pbirb-mcp": {
      "command": "uvx",
      "args": [
        "pbirb-mcp"
      ],
      "env": {
        "PBIRB_MCP_LOG_FILE": "YOUR_PBIRB_MCP_LOG_FILE_HERE"
      }
    }
  }
}
Frequently asked questions
Microcharts is categorized under Data Visualization and uses a local stdio subprocess. Pbirb MCP belongs to Data Visualization and uses a local stdio subprocess. Pick Microcharts for data visualization work and Pbirb MCP for data visualization.
Copy the mcpServers block from the config section on this page into your client's config (for example claude_desktop_config.json or ~/.cursor/mcp.json), then fully restart the client.
Microcharts is listed as free. Auth: no auth required. Pbirb MCP has no declared pricing — check the project's own site. If a server needs environment variables such as API keys, define them under the env key in your client's MCP config.
Yes. MCP clients support multiple servers: add ganapativs-microcharts and pbirb-mcp as separate keys in the same mcpServers object, and your assistant will call tools from either one.
On AllMCPs, Microcharts has a quality signal of 68/100 (Great) with 3 views, 0 installs and 199 GitHub stars. Pbirb MCP has 51/100 (Good) with 0 views, 0 installs and 6 GitHub stars.