Dotplot MCP README
The full upstream README, mirrored here for reference. Install config, tool schemas, adoption signals, and an original overview live on the Dotplot MCP listing page.
Dot Plot MCP
See individual users, not aggregate charts.
English | 한국어
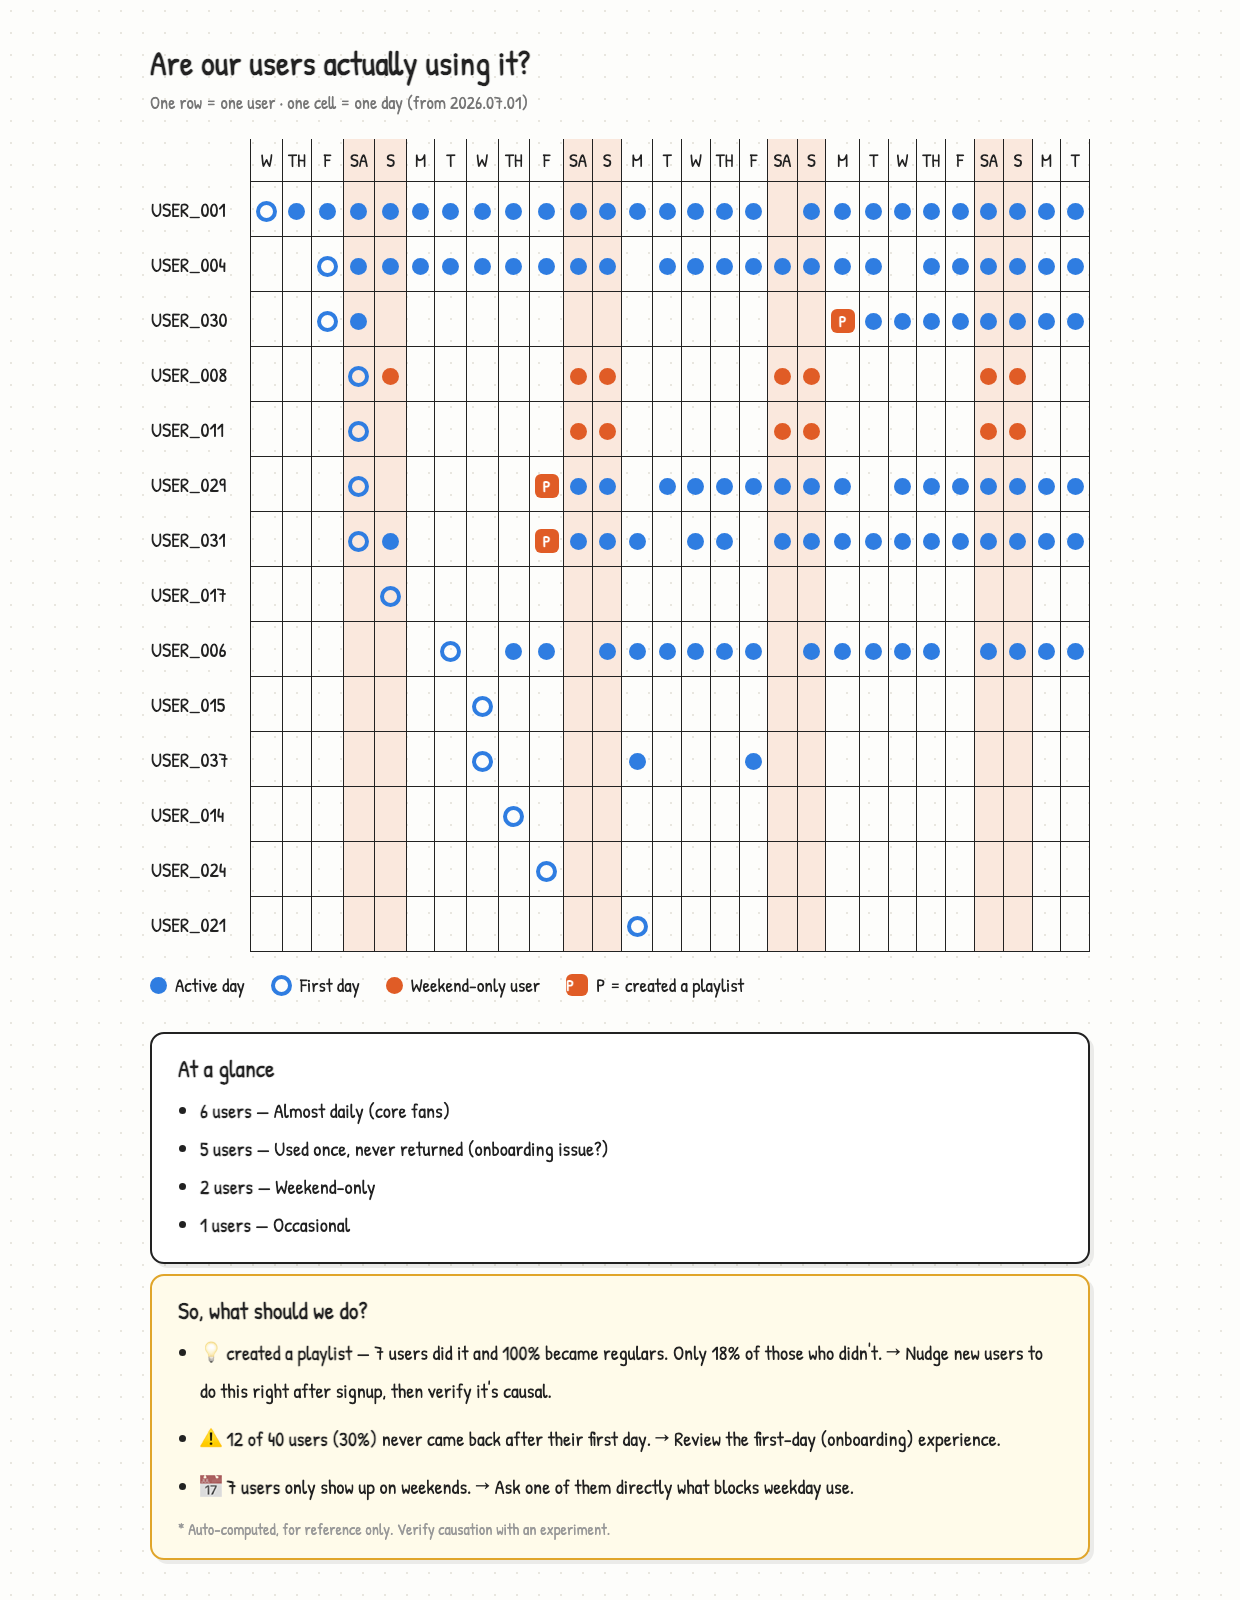
Install
Paste this to your agent and it sets everything up:
Or do it by hand
Use
Say this in any project:
"Analyze my product"
You get the report above. That's it.
Or use the slash commands:
Claude finds your data, picks the action that means "this user got value", and
writes the report. No events table needed — your orders table already is one:
Nothing tracked yet? Say "add the tracking I'm missing" and Claude reads your code, writes the logging that's absent, and tells you when to come back.
No product to analyze yet? Try the sample
Why this exists
DAU/MAU charts go "up and to the right" as long as new users arrive — even when nobody stays. Until you have hundreds of users, the most informative dashboard is YC's dot plot (David Lieb): one row per user, one cell per day.
Four rules keep it honest:
- Code computes, AI only interprets — same data, same numbers, every time
- Small samples withhold judgment — under 5 users in a group, it says nothing
- Correlation isn't cause — every finding ships with "test this before you believe it"
- Vanity metrics are refused — pick
open_appas your value event and the code says no
Reports come out in your language (English, 한국어, 日本語 built in; anything else translated on the fly with the numbers verified intact).
More
MIT