AllMCPs
BrowseBestCategoriesStackCompareToolsGuidesBlog Log in Submit MCP

Stay in the loop

Get new MCP servers and top picks in your inbox.

AllMCPs

The open directory for discovering and installing Model Context Protocol servers.

Explore

  • Browse servers
  • Best MCP servers
  • Categories
  • MCP clients
  • Agent prompts
  • Stack Builder
  • Compare servers
  • Tags index
  • Submit a server
  • Pricing

Learn

  • Guides hub
  • What is MCP?
  • Install guide
  • Troubleshooting
  • Security
  • Blog
  • Blog RSS

Tools

  • All tools
  • Config generator
  • Config validator
  • MCP playground
  • OpenAPI β†’ MCP
  • Badge generator

For agents

  • API docs
  • Trust & traffic
  • llms.txt β†— (opens in a new tab)
  • Catalog JSON β†— (opens in a new tab)
  • Remote MCP β†— (opens in a new tab)

Company

  • About
  • Contact
  • X (@AllMCPs) β†— (opens in a new tab)
  • GitHub β†— (opens in a new tab)
  • Terms
  • Privacy
AllMCPs VerifiedAllMCPs VerifiedFeatured on Nick LaunchesFeatured on Nick LaunchesLaunch Llama NewsletterLaunch Llama NewsletterVerified DR - allmcps.comVerified DR - allmcps.comFeatured on SaaSGrowFeatured on SaaSGrowFeatured on Twelve ToolsFeatured on Twelve ToolsFeatured on Saaspa.geFeatured on Saaspa.geFeatured on Findly.toolsFeatured on Findly.toolsFeatured on Startup FameFeatured on Startup FameFeatured on LaunchKiwiFeatured on LaunchKiwiFeatured on ScrollLaunchFeatured on ScrollLaunchFeatured on DailyPingsFeatured on DailyPingsFazier badgeFazier badgeFeatured on NewTool.siteFeatured on NewTool.siteFeatured on saasfame.comFeatured on saasfame.comDR Checker - Domain RatingDR Checker - Domain RatingListed on Turbo0Listed on Turbo0Launched on LaunchBoard - Product Launch PlatformLaunched on LaunchBoard - Product Launch PlatformList on SimilarlabsList on Similarlabshttps://codetrendy.comhttps://codetrendy.comListed on DevTool.ioFeatured on BuildlistFeatured on BuildlistAllMCPs VerifiedAllMCPs VerifiedFeatured on Nick LaunchesFeatured on Nick LaunchesLaunch Llama NewsletterLaunch Llama NewsletterVerified DR - allmcps.comVerified DR - allmcps.comFeatured on SaaSGrowFeatured on SaaSGrowFeatured on Twelve ToolsFeatured on Twelve ToolsFeatured on Saaspa.geFeatured on Saaspa.geFeatured on Findly.toolsFeatured on Findly.toolsFeatured on Startup FameFeatured on Startup FameFeatured on LaunchKiwiFeatured on LaunchKiwiFeatured on ScrollLaunchFeatured on ScrollLaunchFeatured on DailyPingsFeatured on DailyPingsFazier badgeFazier badgeFeatured on NewTool.siteFeatured on NewTool.siteFeatured on saasfame.comFeatured on saasfame.comDR Checker - Domain RatingDR Checker - Domain RatingListed on Turbo0Listed on Turbo0Launched on LaunchBoard - Product Launch PlatformLaunched on LaunchBoard - Product Launch PlatformList on SimilarlabsList on Similarlabshttps://codetrendy.comhttps://codetrendy.comListed on DevTool.ioFeatured on BuildlistFeatured on Buildlist
Β© 2026 Jackalope Digital LLC. All rights reserved.
  1. Home
  2. πŸ’» Developer Tools
  3. Debugium
D
Health: Not checked yetWe have not completed a health check for this listing yet.Last checked 8/10/2026, 11:46:00 PM

Debugium

Enrichment pendingWe haven’t run our AI enrichment pass on this listing yet, so the overview, use cases, and FAQ below may be sparse or missing. We work through the catalog over time β€” check back soon.
View Repository

AI-driven live debugger with MCP bridge for Python, JS, TS, Rust, Java, C/C++

Quick Install

Automated & IDE Setup

Copy the AI prompt to install this server into Claude Code, Cursor, or another agent β€” or use 1-click editor setup below.

Add to CursorAdd to VS Code
Manual Client & Custom JSON ConfigExpand JSON β–Ύ

Install Config Generator

Choose your client
claude_desktop_config.json
{
  "mcpServers": {
    "debugium": {
      "command": "npx",
      "args": [
        "-y",
        "debugium"
      ]
    }
  }
}

πŸ’‘ Paste into ~/Library/Application Support/Claude/claude_desktop_config.json (macOS) or %APPDATA%\Claude\claude_desktop_config.json (Windows)

Install Directory Badge Claim listing AlternativesπŸ’» More in Developer Tools

Documentation Overview

Debugium

A multi-language debugger with a real-time web UI and LLM integration via MCP.

Debug Python, JavaScript, TypeScript, C, C++, Rust, Java, Scala, and WebAssembly programs from your browser β€” with AI-driven analysis through the Model Context Protocol.

CI Docs

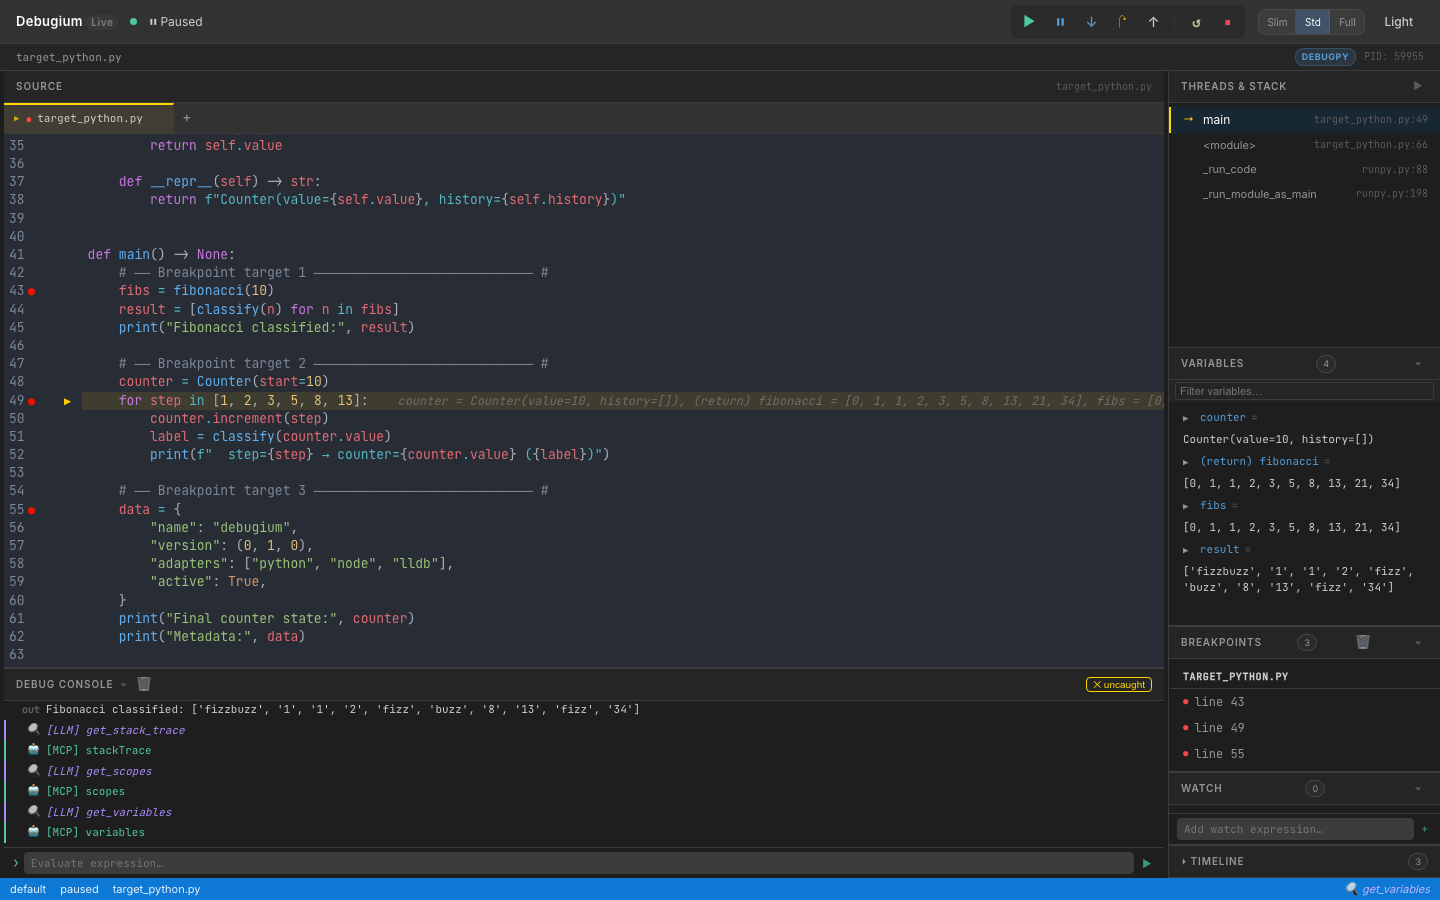
Debugium UI β€” paused at a breakpoint in target_python.py with variables, call stack, breakpoints, watch, timeline, and console panels


Features

Web UI

  • Real-time web UI β€” source viewer, breakpoints, variables (recursive expansion), call stack, console, timeline, watch expressions, findings β€” all updated live via WebSocket
  • Multi-tab source viewer β€” open multiple files, click stack frames to navigate
  • Variable search β€” filter variables by name with recursive expansion
  • Changed-variable highlighting β€” variables that changed since last stop shown in orange
  • Thread selector β€” switch between threads in multi-threaded programs
  • Panel collapse & resize β€” drag to resize, toggle to collapse; Slim / Standard / Full layout presets
  • Dark / light mode toggle
  • Auto-reconnect β€” UI reconnects after a dropped WebSocket, with visual status indicator
  • Keyboard shortcuts β€” F5 continue, F10 step over, F11 step in, Shift+F11 step out, Ctrl/Cmd+D dark mode
  • Button animations β€” in-flight spinner and completion flash for debug commands

Debugging

  • Multi-language β€” Python (debugpy), Node.js/TypeScript (js-debug), C/C++/Rust (lldb-dap), Java (java-debug), Scala (Metals), WebAssembly (lldb-dap), or any DAP adapter via dap.json
  • Comprehensive DAP coverage β€” 35+ DAP requests: breakpoints, stepping, goto, memory read/write, disassembly, and more
  • Breakpoints β€” conditional, logpoints, hit-count, function, data (watchpoints), exception, run-to-cursor (continue_until)
  • Multi-session β€” debug multiple programs simultaneously, with child session routing (js-debug)
  • Remote debugging β€” attach to debugpy, JDWP, or Node inspector running on another machine or container

LLM / MCP Integration

  • 64 MCP tools β€” the full debug session exposed to Claude or any LLM
  • Capability-gated tools β€” tools automatically shown/hidden based on adapter capabilities
  • Compound tools β€” get_debug_context (orient in one call), step_until, step_until_change, run_until_exception, explain_exception, get_call_tree, compare_snapshots, find_first_change
  • Execution timeline β€” every stop recorded with changed variables and stack summary
  • Watch expressions β€” evaluated automatically at every breakpoint, manageable by LLM or UI
  • Annotations & findings β€” pin notes to source lines, record conclusions visible in the UI
  • Session export/import β€” save and restore debugging knowledge across sessions

CLI Control

  • Full CLI β€” 13 subcommands to drive sessions from a second terminal without the web UI
  • Auto-discovery β€” port file at ~/.debugium/port, session logs in ~/.debugium/sessions/

Install

Claude Code Plugin (recommended)

Code
/plugin marketplace add Algiras/debugium
/plugin install debugium@debugium

Then add to your project's .mcp.json (see MCP Tools below).

macOS / Linux binary

Terminal
curl -fsSL https://raw.githubusercontent.com/Algiras/debugium/main/install.sh | bash

From source

bash
# Prerequisites: Rust stable + wasm-pack
cargo install wasm-pack

# Build UI
wasm-pack build crates/debugium-ui --target web --out-dir pkg
cp crates/debugium-ui/pkg/cm_init.js         crates/debugium-ui/dist/pkg/
cp crates/debugium-ui/pkg/debugium_ui.js      crates/debugium-ui/dist/pkg/
cp crates/debugium-ui/pkg/debugium_ui_bg.wasm crates/debugium-ui/dist/pkg/

# Build & install server
cargo install --path crates/debugium-server

Usage

Debug a Python file

bash
debugium launch my_script.py --adapter python

Debug a Node.js / TypeScript file

bash
debugium launch app.js --adapter node
debugium launch app.ts --adapter typescript

Debug C / C++ / Rust

bash
# C or C++ (compile with -g for debug info)
cc -g -O0 main.c -o main && debugium launch ./main --adapter lldb
c++ -g -O0 main.cpp -o main && debugium launch ./main --adapter lldb

# Rust
cargo build && debugium launch target/debug/my_binary --adapter lldb

Debug Java / Scala

bash
# Java (requires microsoft/java-debug adapter)
debugium launch MainClass --adapter java

# Scala (connect to a running Metals DAP server)
debugium launch build-target --adapter metals
debugium launch build-target --adapter metals:5005  # custom port

Attach to a running process (remote debugging)

bash
# Python (debugpy listening on port 5678)
debugium attach --port 5678 --adapter python

# Java (JDWP on port 5005)
debugium attach --port 5005 --adapter java

# Node.js (inspector on port 9229)
debugium attach --port 9229 --adapter node

Or via MCP: attach_session(port=5678, adapter="python", breakpoints=["/path/app.py:42"])

Use a custom adapter via dap.json

bash
# Create a dap.json (see dap.json.example) then:
debugium launch my_program --config ./dap.json

# Or place dap.json in cwd / .debugium/ for auto-discovery:
debugium launch my_program   # finds ./dap.json automatically

Set initial breakpoints

bash
debugium launch my_script.py --adapter python \
  --breakpoint /abs/path/my_script.py:42 \
  --breakpoint /abs/path/helpers.py:15

Enable LLM / MCP integration

Add a .mcp.json to your project root (Claude Code picks this up automatically):

config.json
{
  "mcpServers": {
    "debugium": {
      "command": "debugium",
      "args": ["mcp"]
    }
  }
}

Then launch the session normally β€” the MCP server connects to whichever port is active:

bash
debugium launch my_script.py --adapter python --breakpoint /abs/path/my_script.py:42

Claude Code will now have access to all Debugium MCP tools. See CLAUDE.md for the recommended workflow and SKILL.md for the full tool reference.


CLI Control Commands

Once a session is running (debugium launch …), you can drive it from a second terminal β€” or from an LLM agent β€” without touching the web UI.

Port is auto-discovered from ~/.debugium/port; override with --port.

Global flags (all subcommands)

FlagDefaultDescription
--port PORT~/.debugium/portServer port to connect to
--session IDdefaultSession to target
--jsonoffPrint raw JSON instead of human-readable output

Inspection

bash
debugium sessions                  # list active sessions
debugium threads                   # list threads
debugium stack                     # show call stack
debugium vars                      # show local variables (auto-resolves top frame)
debugium vars --frame-id 2         # show variables for a specific frame
debugium eval "len(fibs)"          # evaluate expression in top frame
debugium eval "x + 1" --frame-id 2
debugium source path/to/file.py    # print full source file
debugium source path/to/file.py --line 43  # windowed Β±10 lines with β†’ marker
debugium context                   # full snapshot: paused-at, stack, locals, source, breakpoints
debugium context --compact         # same but truncated (3 frames, 10 vars)

Breakpoints

bash
debugium bp set FILE:LINE [FILE:LINE …]   # set breakpoints (replaces existing in that file)
debugium bp list                          # list all breakpoints
debugium bp clear                         # clear all breakpoints

Execution control

bash
debugium continue                  # resume execution
debugium step over                 # step over (next line)
debugium step in                   # step into a function call
debugium step out                  # step out of current function

UI annotations (visible in the web UI)

bash
debugium annotate FILE:LINE "message" [--color info|warning|error]
debugium finding "message"         [--level  info|warning|error]

Example workflow

bash
# Terminal A β€” start the session
debugium launch tests/target_python.py --adapter python \
  --breakpoint "$(pwd)/tests/target_python.py:43"

# Terminal B (or LLM agent) β€” inspect and drive it
debugium sessions
debugium stack
debugium vars
debugium eval "len(fibs)"
debugium bp set tests/target_python.py:49
debugium continue                  # runs to line 49
debugium vars
debugium step over
debugium context --json            # machine-readable snapshot
debugium annotate tests/target_python.py:43 "called here" --color info
debugium finding "fibs has 10 elements" --level info
debugium bp clear

MCP Tools

When connected via MCP, 64 tools are available. Key ones:

CategoryTools
Orientget_debug_context β˜… (paused location + locals + stack + source in one call)
Breakpointsset_breakpoint, set_breakpoints, set_logpoint, list_breakpoints, clear_breakpoints, set_function_breakpoints, set_exception_breakpoints, set_data_breakpoint, list_data_breakpoints, clear_data_breakpoints, breakpoint_locations
Executioncontinue_execution, step_over, step_in, step_out, pause, goto, disconnect, terminate, restart
Inspectionget_stack_trace, get_scopes, get_variables, evaluate, get_threads, get_source, get_capabilities, loaded_sources, source_by_reference, step_in_targets
Mutationset_variable, set_expression
Outputget_console_output, wait_for_output (with from_line to avoid stale matches)
Memoryread_memory, write_memory, disassemble (native debugging)
Historyget_timeline, get_variable_history, compare_snapshots, find_first_change
Annotationsannotate, get_annotations, add_finding, get_findings
Watchesadd_watch, remove_watch, get_watches
Compoundstep_until, step_until_change, continue_until, run_until_exception, explain_exception, get_call_tree, restart_frame
Sessionget_sessions, list_sessions, launch_session, attach_session, stop_session, export_session, import_session
Controlgoto_targets, cancel_request

Note: step_over, step_in, and step_out are blocking β€” they wait for the adapter to pause before returning. Safe to chain back-to-back without sleeps. continue_execution returns console_line_count for use with wait_for_output. Tools like read_memory, goto, and restart_frame only appear when the adapter supports them.

See SKILL.md for the full reference with input schemas.


Keyboard Shortcuts

KeyAction
F5Continue
F10Step Over
F11Step Into
Shift+F11Step Out
Ctrl/⌘+DToggle dark/light mode

Architecture

Code
debugium-server (Rust + Axum)
β”œβ”€β”€ DAP proxy     β€” spawns / attaches to debug adapters (debugpy, js-debug, lldb-dap, java-debug, Metals, custom)
β”œβ”€β”€ HTTP API      β€” /state, /sessions, /annotations, /findings, /watches, /timeline
β”œβ”€β”€ WebSocket     β€” broadcasts DAP events + enriched stop data (changed vars, timeline) to UI
β”œβ”€β”€ MCP stdio     β€” JSON-RPC 2.0 server exposing 64 tools for LLM integration
β”œβ”€β”€ CLI control   β€” 13 subcommands to drive sessions from a second terminal
└── ~/.debugium/  β€” port file, session logs (events.ndjson), debug log

debugium-ui (Leptos + WASM)
β”œβ”€β”€ CodeMirror 6  β€” source viewer with breakpoint gutters, exec arrow, LLM annotations, multi-tab
β”œβ”€β”€ Reactive panels β€” Variables, Stack, Breakpoints, Findings, Watch, Timeline, Console (18 components)
└── WebSocket     β€” receives events, sends DAP commands, auto-reconnects with status indicator

Supported Languages & Adapters

Language--adapter flagPrerequisiteVerified
Pythonpython / debugpypip install debugpyβœ…
Node.jsnode / jsjs-debug (bundled or build from vscode-js-debug)βœ…
TypeScripttypescript / ts / tsxjs-debug + tsx or ts-node in PATHβœ…
C / C++lldb / codelldblldb-dap (Xcode on macOS; apt install lldb on Linux)βœ…
Rustlldb / rustlldb-dap + cargo buildβœ…
Javajava / jvmmicrosoft/java-debug adapter JARβœ…
Scalametals / scalaRunning Metals DAP server⚠️ (requires running Metals)
WebAssemblywasmlldb-dap (LLVM β‰₯16)⚠️ (requires WASM-aware LLVM)
Any DAP adapter--config dap.jsonSee dap.json.exampleβœ…

Remote debugging

Connect to a DAP server running on another machine (or in a container):

config.json
{
  "adapterId": "debugpy",
  "request": "attach",
  "host": "192.168.1.100",
  "port": 5678,
  "pathMappings": [{ "localRoot": ".", "remoteRoot": "/app" }]
}
bash
debugium launch app.py --config remote.json

License

MIT

Related MCP Servers

View all in Developer Tools View all alternatives
  • Claude Task Master logoClaude Task Master

    AI-powered task management system for AI-driven development. Features PRD parsing, task expansion, multi-provider support (Claude, OpenAI, Gemini, Perplexity, xAI), and selective tool loading for optimized context usage.

    πŸ’» Developer Tools7 views
    Compare vs Claude Task Master β†’
  • World Monitor logoWorld Monitor

    Live global intelligence: real-time markets, conflicts, country risk, chokepoints, energy. 39 tools.

    πŸ’» Developer Tools1 views
    Compare vs World Monitor β†’
  • A
    Ai Netcafe

    Compare LLM cost & latency on one prompt, translate PDF keeping layout, cited research, make PPTX

    πŸ’» Developer Tools0 views
    Compare vs Ai Netcafe β†’
  • W
    Windows MCP

    An MCP Server for computer-use in Windows OS

    πŸ’» Developer Tools1 views
    Compare vs Windows MCP β†’

Frequently Asked Questions about Debugium

Add the following block to your claude_desktop_config.json under mcpServers: "mcpServers": { "debugium": { "command": "npx", "args": ["-y", "debugium"] } }

AllMCPs Directory Badge

Full Badge Customizer

Showcase your server listing on GitHub or your project documentation. Embed this dynamic SVG badge to highlight official listing status and live engagement.

Badge Style:
Live Dynamic SVG PreviewDebugium AllMCPs Directory Badge

Markdown (GitHub README)
[![AllMCPs](https://allmcps.com/api/badge/debugium?style=directory)](https://allmcps.com/mcp/debugium)
HTML Embed
<a href="https://allmcps.com/mcp/debugium"><img src="https://allmcps.com/api/badge/debugium?style=directory" alt="Debugium on AllMCPs" /></a>

Technical Specs & Signals

CategoryπŸ’»Developer Tools
More technical detailsExpand β–Ύ
TransportSTDIO
RuntimePython
0/4 checks healthy over the last 6h
Views0
Unique ViewsTotal visits recorded for this listing page on AllMCPs.
Installs0
Installs & Copy ActionsTotal times users copied install commands or configuration snippets for this server.
27Quality signal: Emerging Β· 27/100How this signal is calculated β–Ύ
Server availabilityNot measured

Not scored for repo-hosted servers β€” we can't reach the running server, only its GitHub page. Hosted MCP endpoints are health-checked live.

Verified ownership8/20
Documentation & tools11/30
Adoption & activity1/15
Community engagement0/10

A guidance signal from public completeness & health data β€” not a user rating. New listings start lower and rise as they add docs, get verified, and grow adoption. Signals we can't observe for a listing are skipped, not counted against it.

β˜… Spotlight Slot

Feature Your MCP Server

Get maximum visibility for your server across our directory, search results, and detail pages.

Spotlight Your Server

Own this project?

This directory is pre-filled from public sources. Claim via GitHub README, site badge, or DNS TXT to get the verified badge and attach your website.

Free dofollow backlink: after claiming, verify your product site and place a dofollow AllMCPs badge β€” we recheck it stays live.

Claim & get free dofollow

Share & Embed

Add our SVG badge (dark/light directory styles) or embeddable widget to your site.

Explore more

More in πŸ’» Developer Tools β†’Best MCP servers for Developers β†’Alternatives to Debugium β†’Install in Claude DesktopInstall in CursorInstall in VS Code