Chrome breakpoint debugging MCP server for inspecting runtime values and stepping through code
Quick Install
Automated & IDE SetupCopy the AI prompt to install this server into Claude Code, Cursor, or another agent — or use 1-click editor setup below.
Not yet automatically verified
We haven't yet run this listing's install command through our automated sandbox check. This isn't a red flag — we're steadily working through the catalog.
Manual Client & Custom JSON ConfigExpand JSON ▾
Client Config & Setup
Choose your client or environment
Target File:
💡 Paste the JSON block into your client's configuration file under mcpServers, then restart the application.
Documentation Overview
chrome-debugger-mcp
English
An MCP server for breakpoint-driven Chrome debugging.
chrome-debugger-mcp exposes Chrome DevTools Protocol primitives as MCP tools so an AI agent can attach to a real Chrome tab, pause execution, inspect scope values, evaluate expressions inside the current call frame, and step through code with runtime facts instead of guessing from static source.
It is not a general browser automation server. The focus is runtime debugging.
Core Capabilities
- Attach to a real Chrome tab over CDP after explicit user confirmation
- Pause at breakpoints or
debugger;statements and wait for the exact pause you expect - Read local, closure, and module scope values from the paused frame
- Evaluate JavaScript in the current call frame and step execution forward
- Resume cleanly so the agent can continue with actual runtime values
Demo
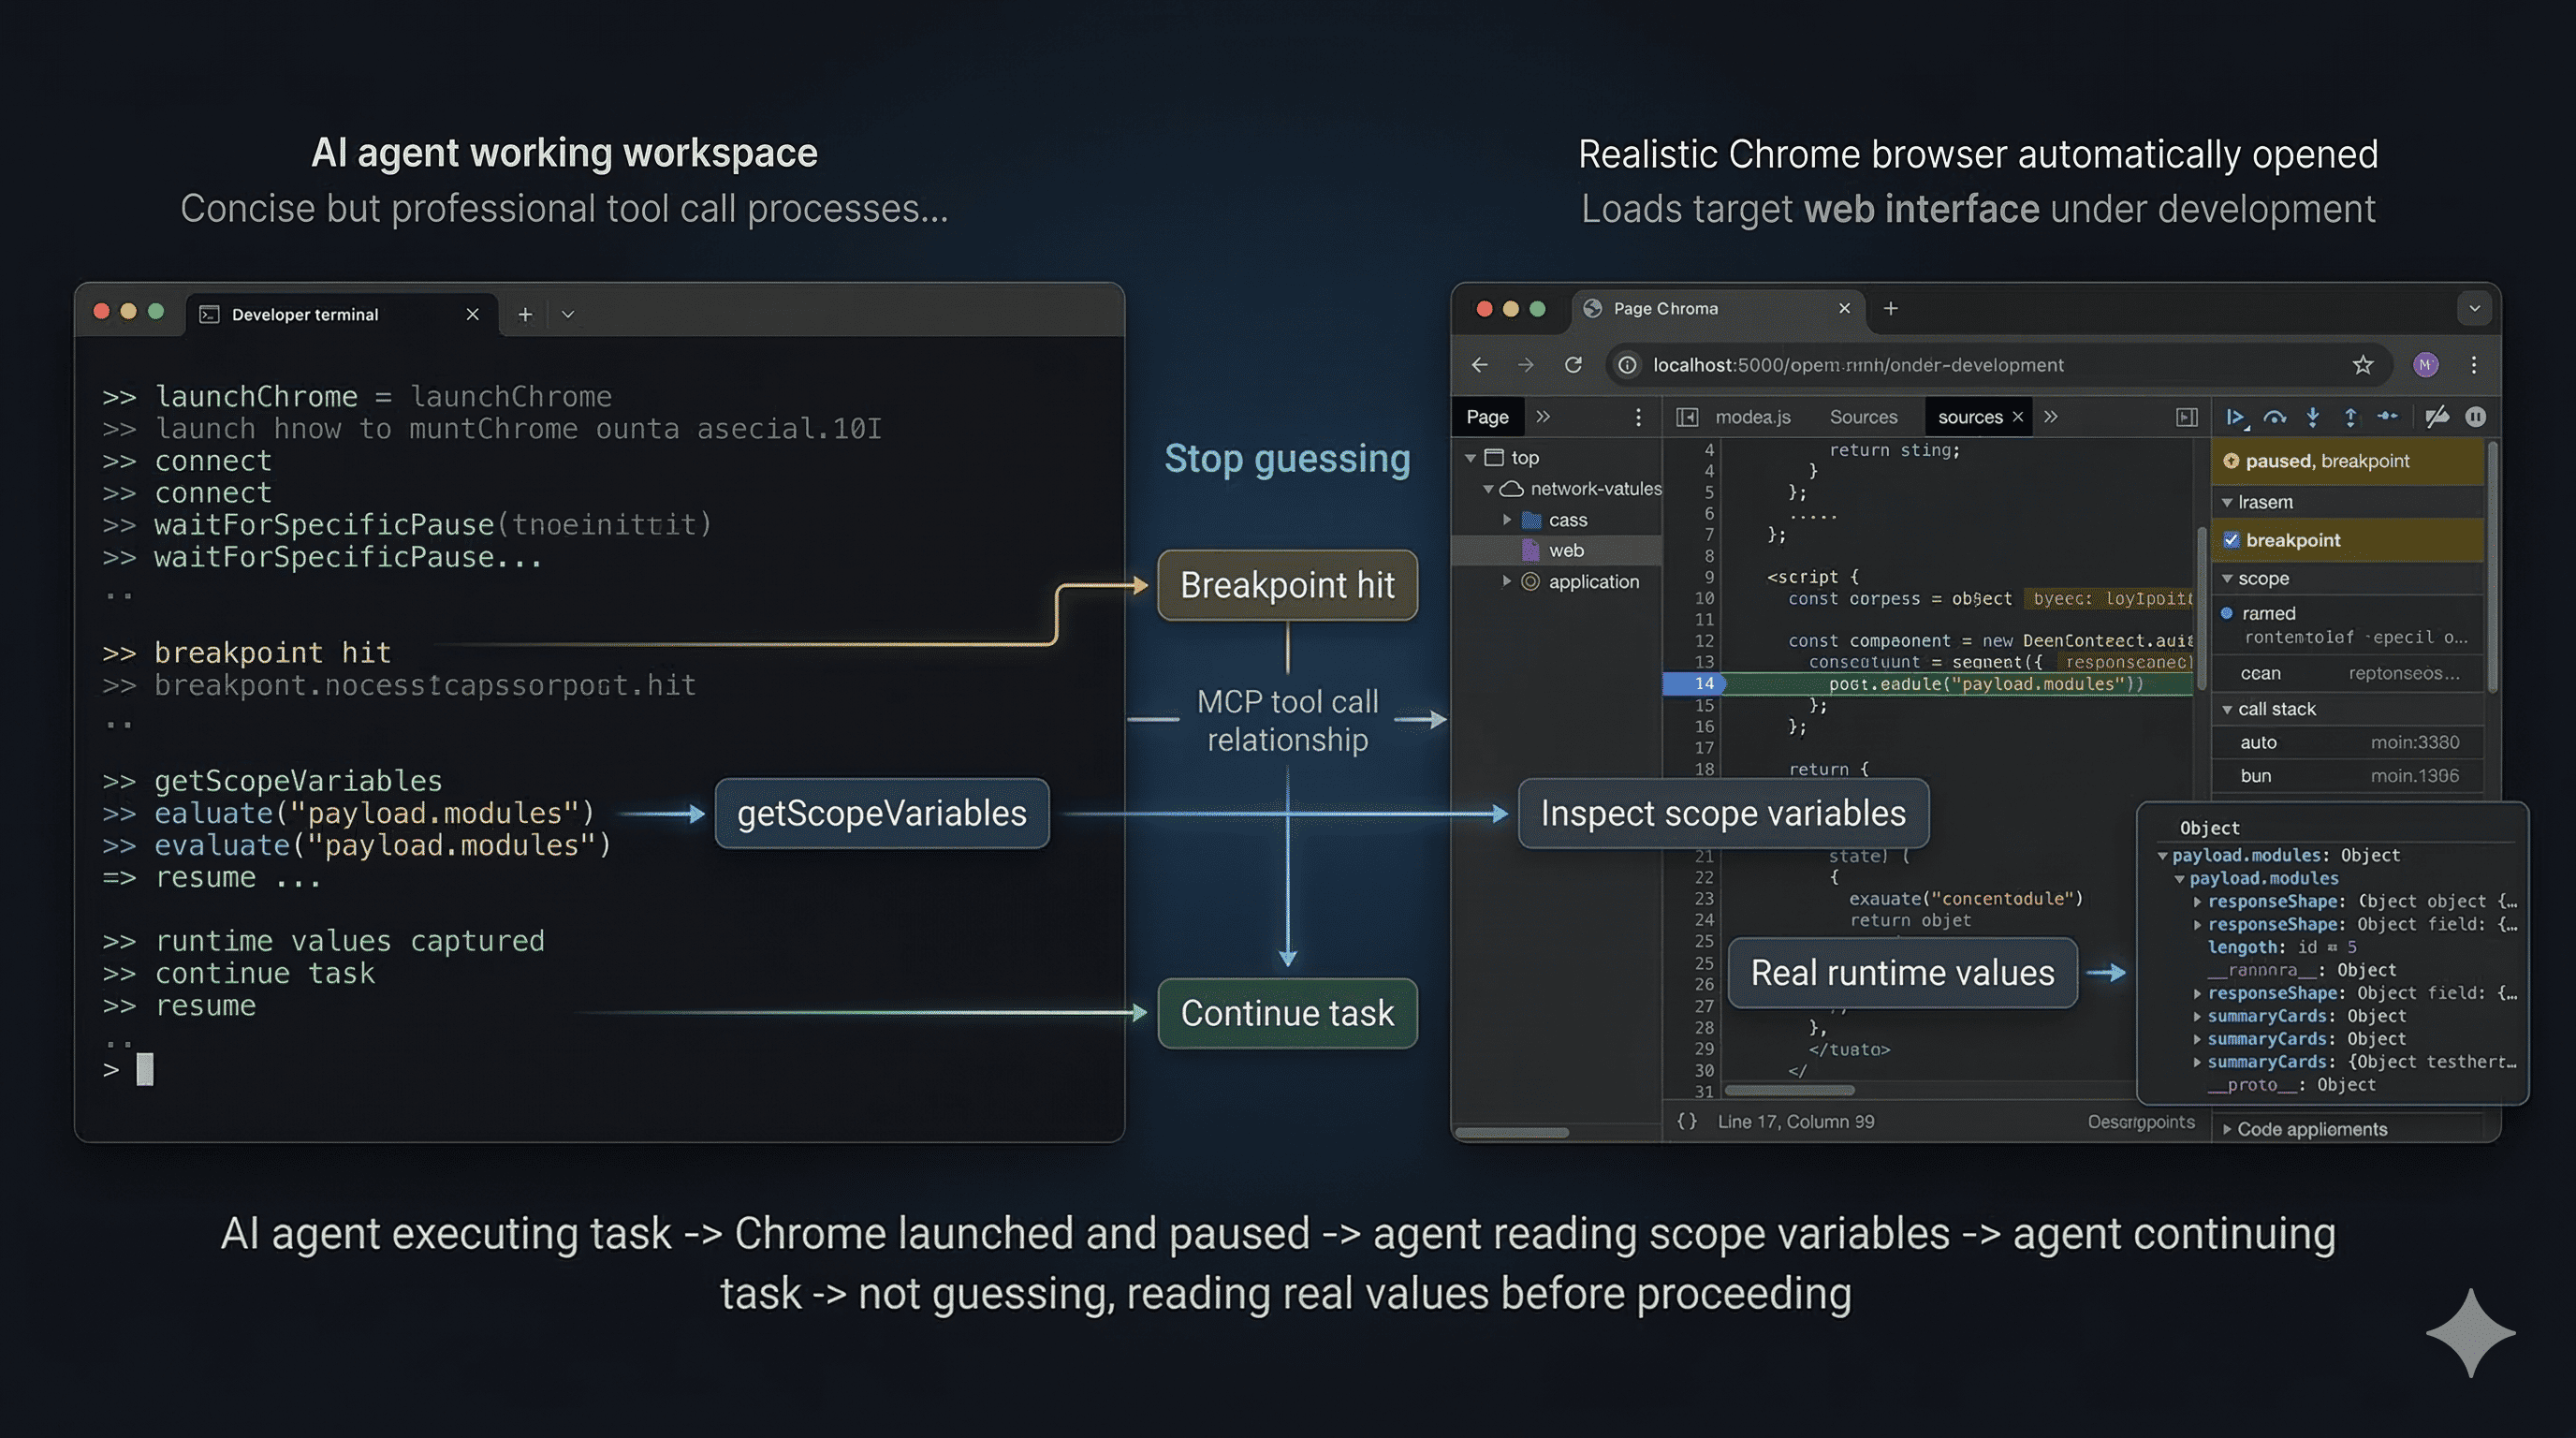
Demo: the agent launches Chrome, waits for a breakpoint, inspects real scope variables, and resumes with runtime facts instead of guessing.
MCP Client Configuration
Use the published package
Installation
From npm
Or install it globally:
From source
Other Highlights
- Launch a dedicated Chrome instance with remote debugging enabled
- Set and remove DevTools breakpoints without editing source code
- Reload the page through CDP so breakpoints reliably bind after navigation
- Poll debugger state when the MCP client has short request timeouts
- Emit
_uipayloads and logging messages that clients can surface to the user
Why It Helps
Many browser-focused MCP tools are strong at DOM interaction and network inspection, but weak at runtime debugging. This server gives an MCP client the missing loop you would normally use in Chrome DevTools: attach to the right tab, pause at the right time, inspect real values, step if needed, and resume cleanly.
It also adds guardrails that prevent common agent mistakes:
- guessing which tab to attach to
- concluding behavior without inspecting runtime values
- ending the turn between
reloadPage()andwaitForSpecificPause()
Requirements
- Google Chrome installed locally
- An MCP client that supports stdio servers and tool calling
- Access to the application you want to debug
- Local source access if you plan to insert temporary
debugger;statements
Tooling Model
The server runs over stdio and exposes MCP tools. The most important tools are:
startDebuggingSession: returns the recommended debugging workflow and critical rules for agent behaviorlaunchChrome: launches a dedicated Chrome instance with remote debugging enabledlistTargets: lists available Chrome tabs and requires the user to pick oneconnect: attaches to the confirmed tabsetBreakpoint: creates a CDP breakpoint without modifying source filesremoveBreakpoint: removes a breakpoint created bysetBreakpointreloadPage: reloads the current page through CDPwaitForSpecificPause: waits for the next pause and checks whether it matches a target file and linewaitForPause: waits for any pause without location matchinggetScopeVariables: reads local, closure, and module scope values from the paused frameevaluate: executes JavaScript in the paused call framestepInto,stepOver,stepOut: standard execution controlresume: resumes execution after inspectiongetStatus: non-blocking polling for connected or paused stateforcePause: requests a pause at the next JavaScript statement
Recommended Workflow
For AI clients, the intended flow is:
- Call
startDebuggingSession(). - Call
launchChrome()or use an already-running Chrome instance with a CDP port. - Call
listTargets()and show the full tab list to the user. - Wait for the user to confirm the exact page URL.
- Call
connect({ targetUrl }). - Insert a temporary
debugger;statement in local source code, or callsetBreakpoint(). - Call
reloadPage(). - Immediately call
waitForSpecificPause()in the same turn. - Call
getScopeVariables()andevaluate()to inspect runtime values. - Step if necessary with
stepInto(),stepOver(), orstepOut(). - Call
resume(). - Remove any temporary
debugger;statements from source code.
Important Rules For Agent Authors
This server is designed for tool-using agents, not only for humans. If you are integrating it into an MCP client, keep these rules:
- Never skip
listTargets(). - Never guess the target URL, even if only one tab is open.
- Always wait for explicit user confirmation before
connect(). - After
reloadPage(), immediately callwaitForSpecificPause()orwaitForPause()in the same turn. - Do not explain behavior from static code when runtime values can be inspected directly.
- Always
resume()after inspection. - If you added temporary
debugger;statements to source code, remove them before finishing.
How waitForSpecificPause Matches
waitForSpecificPause is the preferred waiting primitive because it is more reliable than waiting for an arbitrary pause.
It matches a pause using two strategies:
- URL fragment plus line tolerance
- URL fragment plus
debugger-statementpause reason
The second path matters when source maps, transpilation, or bundling shift compiled line numbers away from editor line numbers.
Example Tool Sequence
An agent debugging a local Vite app might do something like this:
launchChrome({ dryRun: true })launchChrome()listTargets()- Wait for the user to confirm
http://127.0.0.1:5173 connect({ targetUrl: "127.0.0.1:5173" })- Insert
debugger;inApp.jsx reloadPage()waitForSpecificPause({ urlFragment: "App.jsx", line: 62, actionHint: "click the Refetch payloads button" })getScopeVariables()evaluate({ expression: "payload.modules" })resume()
Chrome Launch Behavior
launchChrome() uses a dedicated profile so it does not interfere with the user's normal browser session.
Defaults:
- remote debugging port:
9222 - profile directory:
~/.chrome-debug-profile
Expected Chrome binary locations:
- macOS:
/Applications/Google Chrome.app/Contents/MacOS/Google Chrome - Linux:
google-chrome - Windows:
C:\Program Files\Google\Chrome\Application\chrome.exe
If automatic launch fails, the tool returns a command the user can run manually.
Local Playground
This repository includes a disposable test app under test/ so you can exercise the debugger server against a realistic browser workflow.
Start the mock service
The service listens on http://127.0.0.1:3030.
Start the web app
The web app runs on http://127.0.0.1:5173.
Useful places to pause:
test/web/src/App.jsxinsideloadWorkbenchtest/web/src/App.jsxinsideloadModuleDetailtest/web/src/App.jsxaround the unfinished detail sections
Runtime payload areas worth inspecting:
summaryCardsmodulesapiContractsnextActionsresponseShape
Troubleshooting
No targets found
Make sure Chrome is running with --remote-debugging-port=9222 and the target page is open.
More than one tab matches targetUrl
Pass a more specific substring so the match becomes unique.
waitForPause or waitForSpecificPause times out
This can happen when:
- the page action was never triggered
- the wrong breakpoint was set
- the MCP client itself has a shorter request timeout than the tool call
If your client times out quickly, use getStatus() to poll or increase the client timeout.
The paused line number does not match the editor line
Bundlers and transpilers can shift compiled line numbers. Use waitForSpecificPause() and rely on URL fragment matching plus debugger-statement semantics.
Chrome does not launch automatically
The machine may use a non-default Chrome install path. Run the returned launch command manually or adjust the implementation to match your environment.
Development
The implementation lives in:
src/index.ts: MCP tool definitions and user-facing workflow hintssrc/chrome-manager.ts: Chrome DevTools Protocol integration and debugger state management
License
MIT
中文
一个面向 Chrome 断点调试的 MCP Server。
chrome-debugger-mcp 把 Chrome DevTools Protocol 的核心调试能力暴露为 MCP 工具,让 AI agent 可以连接真实的 Chrome 标签页,在运行时暂停执行、读取作用域变量、在当前调用帧中执行表达式、单步跟踪代码,并基于真实值继续任务,而不是只靠静态源码猜测行为。
它不是通用浏览器自动化工具。它的重点是运行时调试。
核心能力
- 在用户明确确认后,通过 CDP 连接真实的 Chrome 标签页
- 在断点或
debugger;命中时暂停,并等待指定文件和行附近的 pause - 读取当前暂停帧中的 local、closure、module 作用域变量
- 在当前调用帧里执行 JavaScript,并继续单步跟踪
- 检查完成后恢复执行,让 agent 基于真实运行时值继续工作
功能演示
演示流程:agent 拉起 Chrome,等待断点命中,读取真实作用域变量,再基于运行时事实继续执行,而不是靠猜测推进。
MCP 客户端配置
使用已发布包
安装方式
从 npm 使用
也可以全局安装:
从源码运行
其他特点
- 启动带远程调试端口的独立 Chrome 实例
- 无需修改源码即可设置和移除断点
- 通过 CDP 重载页面,确保跳转后断点可靠绑定
- 当 MCP 客户端请求超时较短时,可轮询调试器状态
- 输出
_ui结果和 logging 消息,方便客户端展示给用户
Related MCP Servers
Adoption & maintenance
Factual signals from GitHub, npm, and our automated checks — not a rating.
GitHub stars
1
Stargazers on the source repository.
npm downloads
261
Package downloads in the last 30 days.
Last commit
6mo ago
Most recent push to the default branch.
Directory activity
1 views
Config copies, upvotes, and views on AllMCPs.
Reviews
No reviews yet — be the first to share how this listing worked for you.
Frequently Asked Questions about Chrome Debugger MCP
AllMCPs Directory Badge
Showcase your server listing on GitHub or your project documentation. Embed this dynamic SVG badge to highlight official listing status and live engagement.
Badge Style:
Live Dynamic SVG Preview
Markdown (GitHub README)
[](https://allmcps.com/mcp/chrome-debugger-mcp)HTML Embed
<a href="https://allmcps.com/mcp/chrome-debugger-mcp"><img src="https://allmcps.com/api/badge/chrome-debugger-mcp?style=directory" alt="Chrome Debugger MCP on AllMCPs" /></a>Technical Specs & Signals
CategoryDeveloper Tools
4/6 checks healthy over the last 46d
39Quality signal: Fair · 39/100How this signal is calculated ▾
Server availabilityNot measured
Not scored for repo-hosted servers — we can't reach the running server, only its GitHub page. Hosted MCP endpoints are health-checked live.
Verified ownership10/20
Documentation & tools16/30
Adoption & activity3/15
Community engagement0/10
A guidance signal from public completeness & health data — not a user rating. New listings start lower and rise as they add docs, get verified, and grow adoption. Signals we can't observe for a listing are skipped, not counted against it.
Supply-chain signal
No high-severity advisories surfaced by our automated scan.
Critical 0High 0Medium 0Low 0
Scanned 6d ago via OSV.dev · chrome-debugger-mcp (npm)
Own this project?
This directory is pre-filled from public sources. Claim via GitHub README, site badge, or DNS TXT to unlock edit access and the Official badge and attach your website — proof is checked automatically, then reviewed by our team.
Free dofollow backlink: add your website and place the AllMCPs badge on it — no claim needed. We detect it automatically and keep it verified as long as the badge stays live.
Claim & get free dofollowShare & Embed
Add our SVG badge (dark/light directory styles) or embeddable widget to your site.