ChemDraw MCP (unofficial) README
The full upstream README, mirrored here for reference. Install config, tool schemas, adoption signals, and an original overview live on the ChemDraw MCP (unofficial) listing page.
chemdraw-mcp



Chat → chemical structure. An MCP server for Claude Desktop: you describe a molecule, a reaction or a lab result in plain words, and it draws the figure — a print-ready PNG/SVG rendered locally with RDKit, plus an interactive preview inside the chat. "Draw aspirin" is already a complete command.
Built for pharmacy and chemistry students who spend too much time clicking hexagons. 20 tools cover what a report or a slide actually needs: structures, reaction schemes, step-by-step mechanisms, substrate-scope figures, TLC plates, titration curves, schematic spectra, substance data sheets, Ph.Eur. assay calculations and Anki decks.
What it costs you: one install command. Apache-2.0, no API key, no sign-up for the server, no ChemDraw licence — you need Claude Desktop and uv, everything else is fetched once. Rendering runs entirely on your machine; only name resolution and the database lookups reach the internet. ChemDraw CDXML is an optional extra format for people who want to keep editing there, never a requirement.
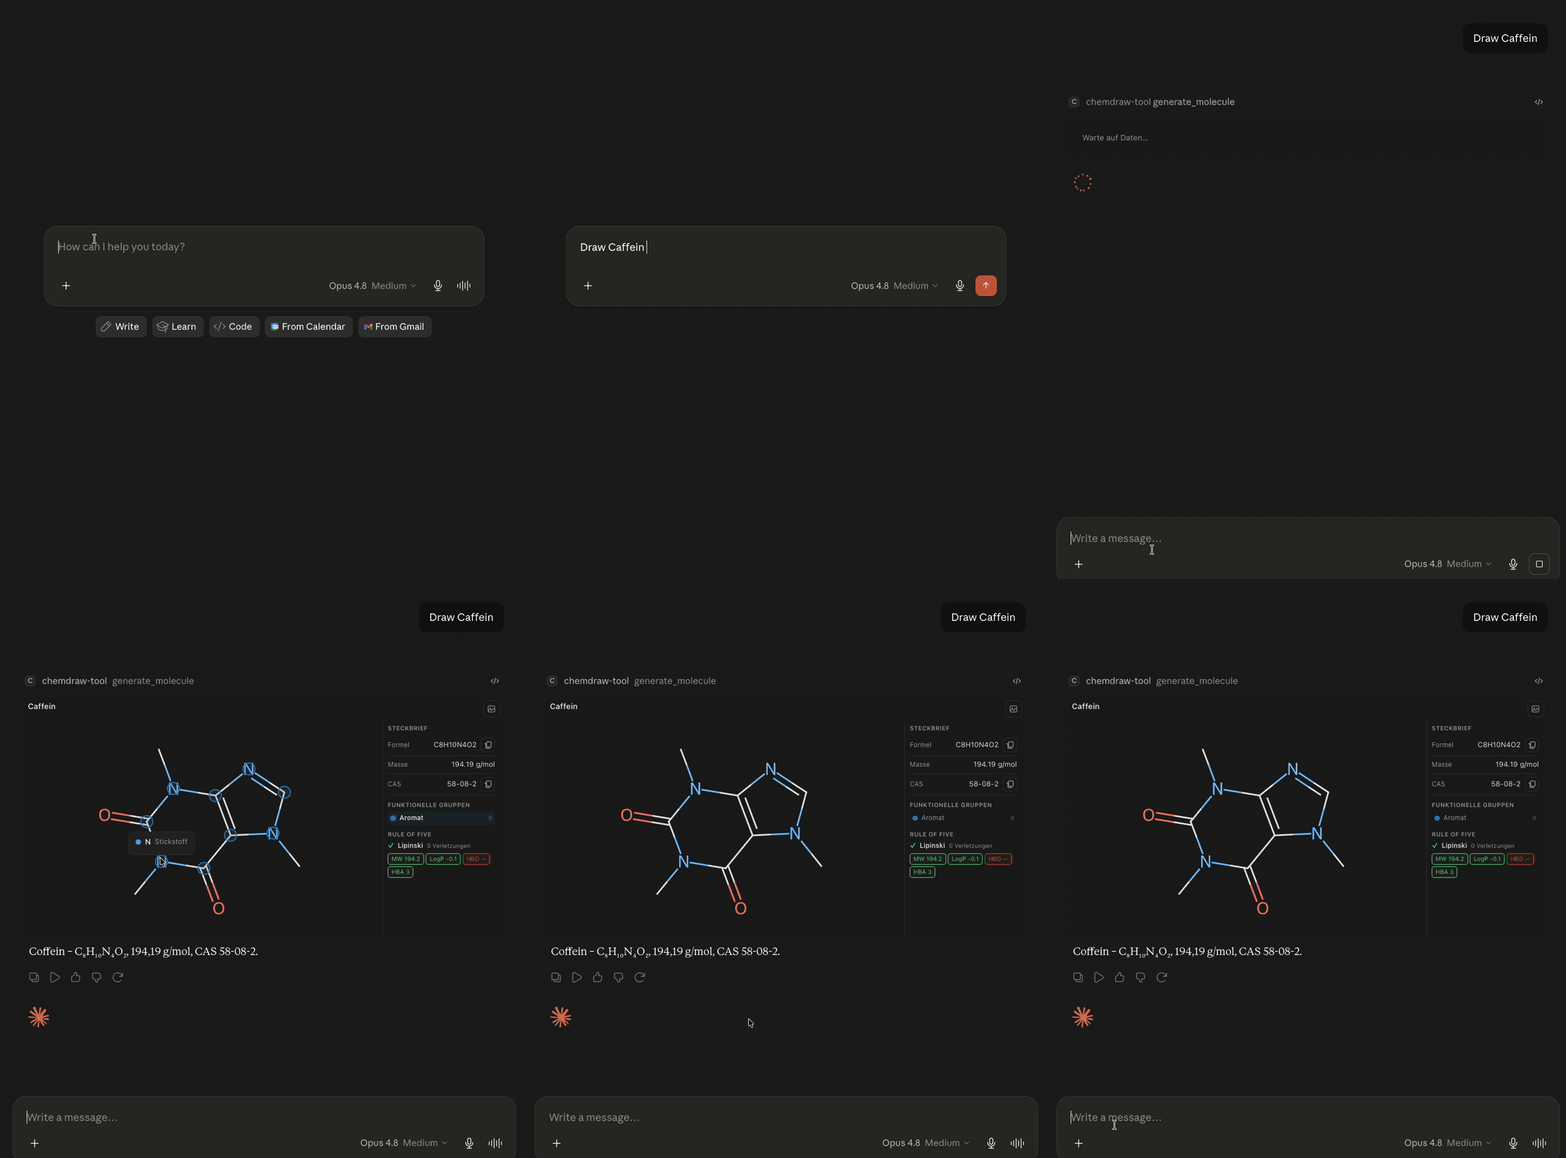
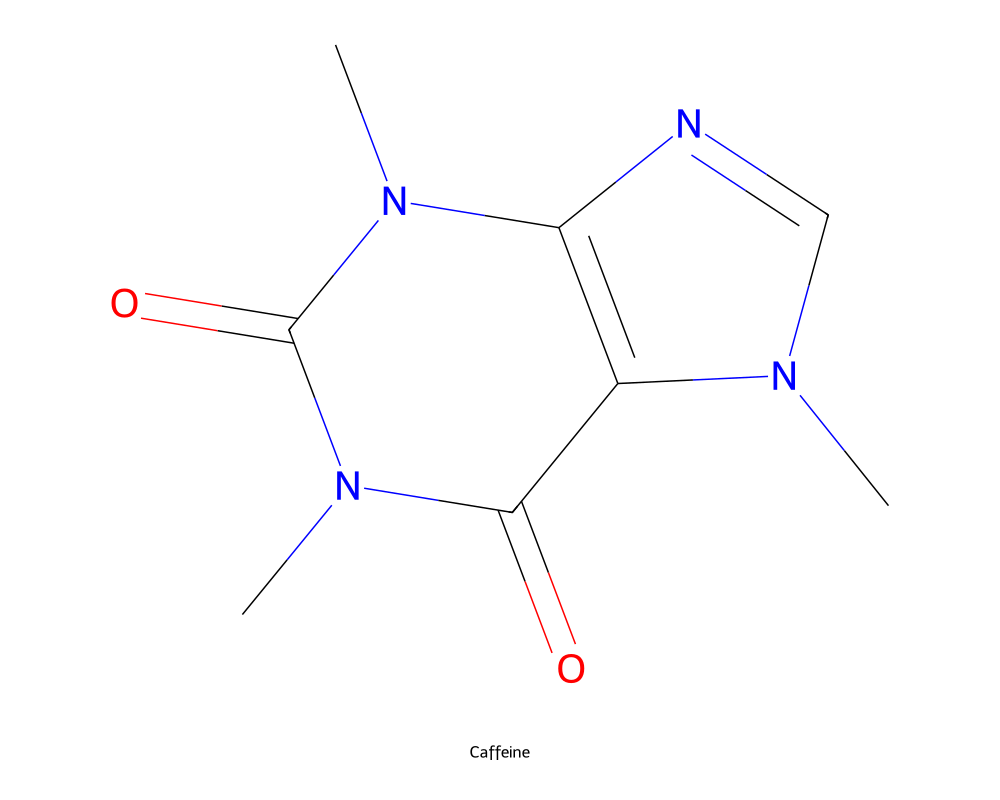
Example output
"Draw caffeine" — print-ready PNG, generated by generate_molecule:
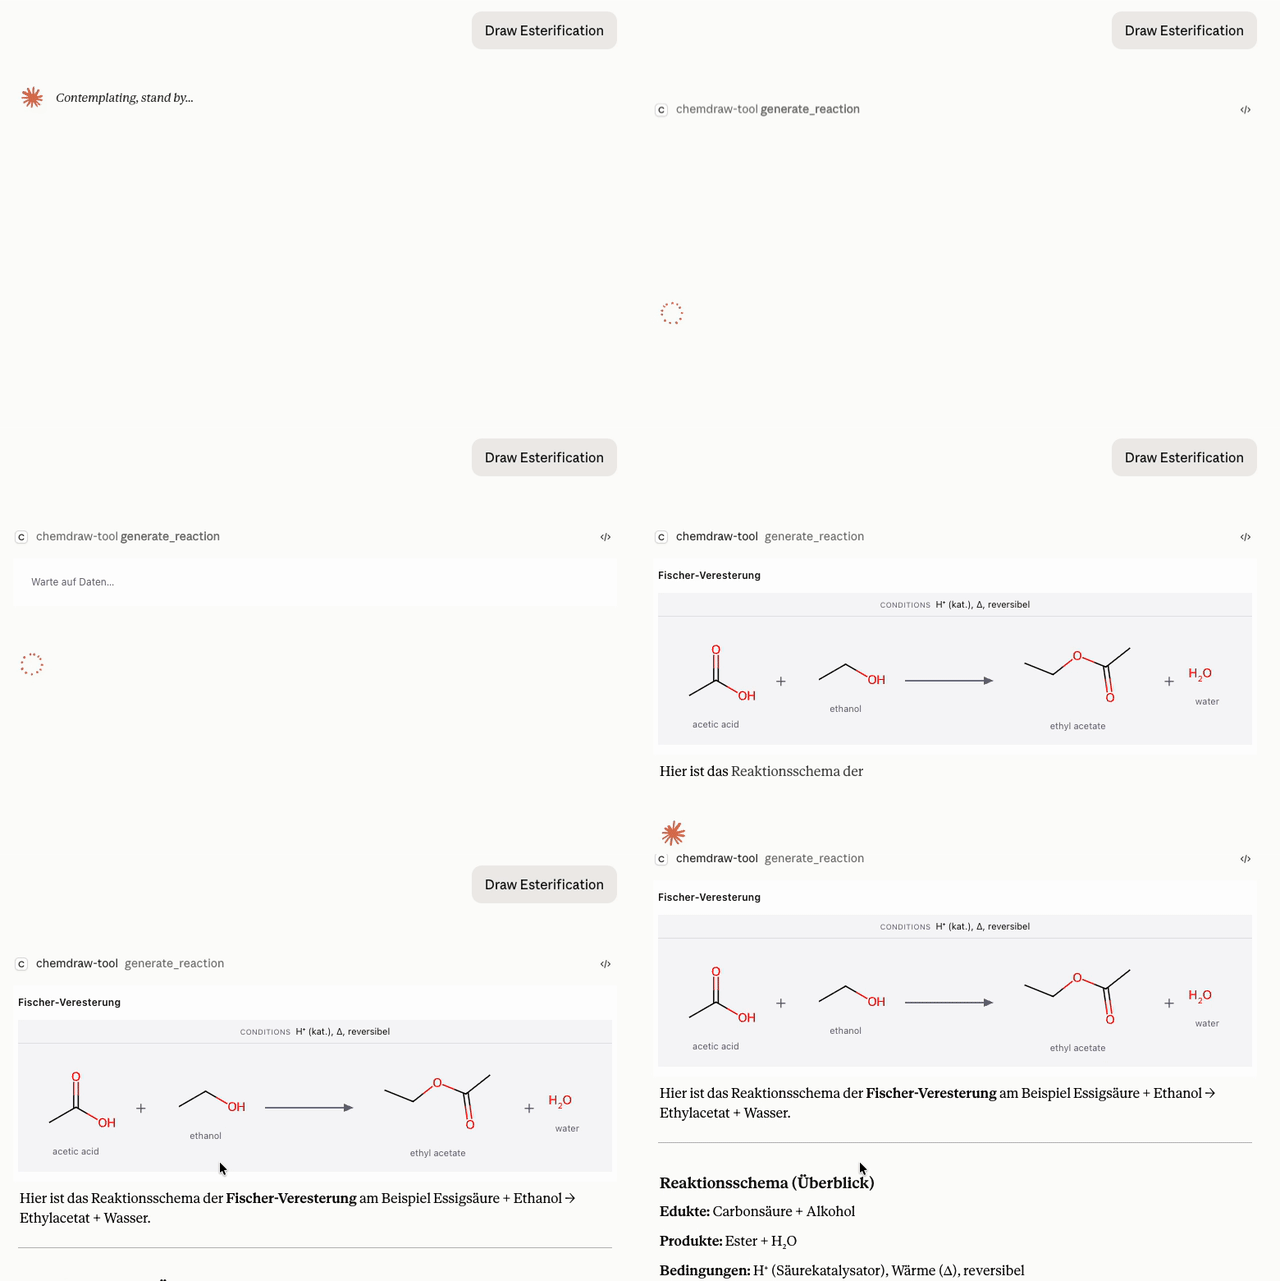
"Show the Fischer esterification of ethanol with acetic acid" —
generate_reaction renders the scheme with conditions above the arrow,
live in the chat panel:
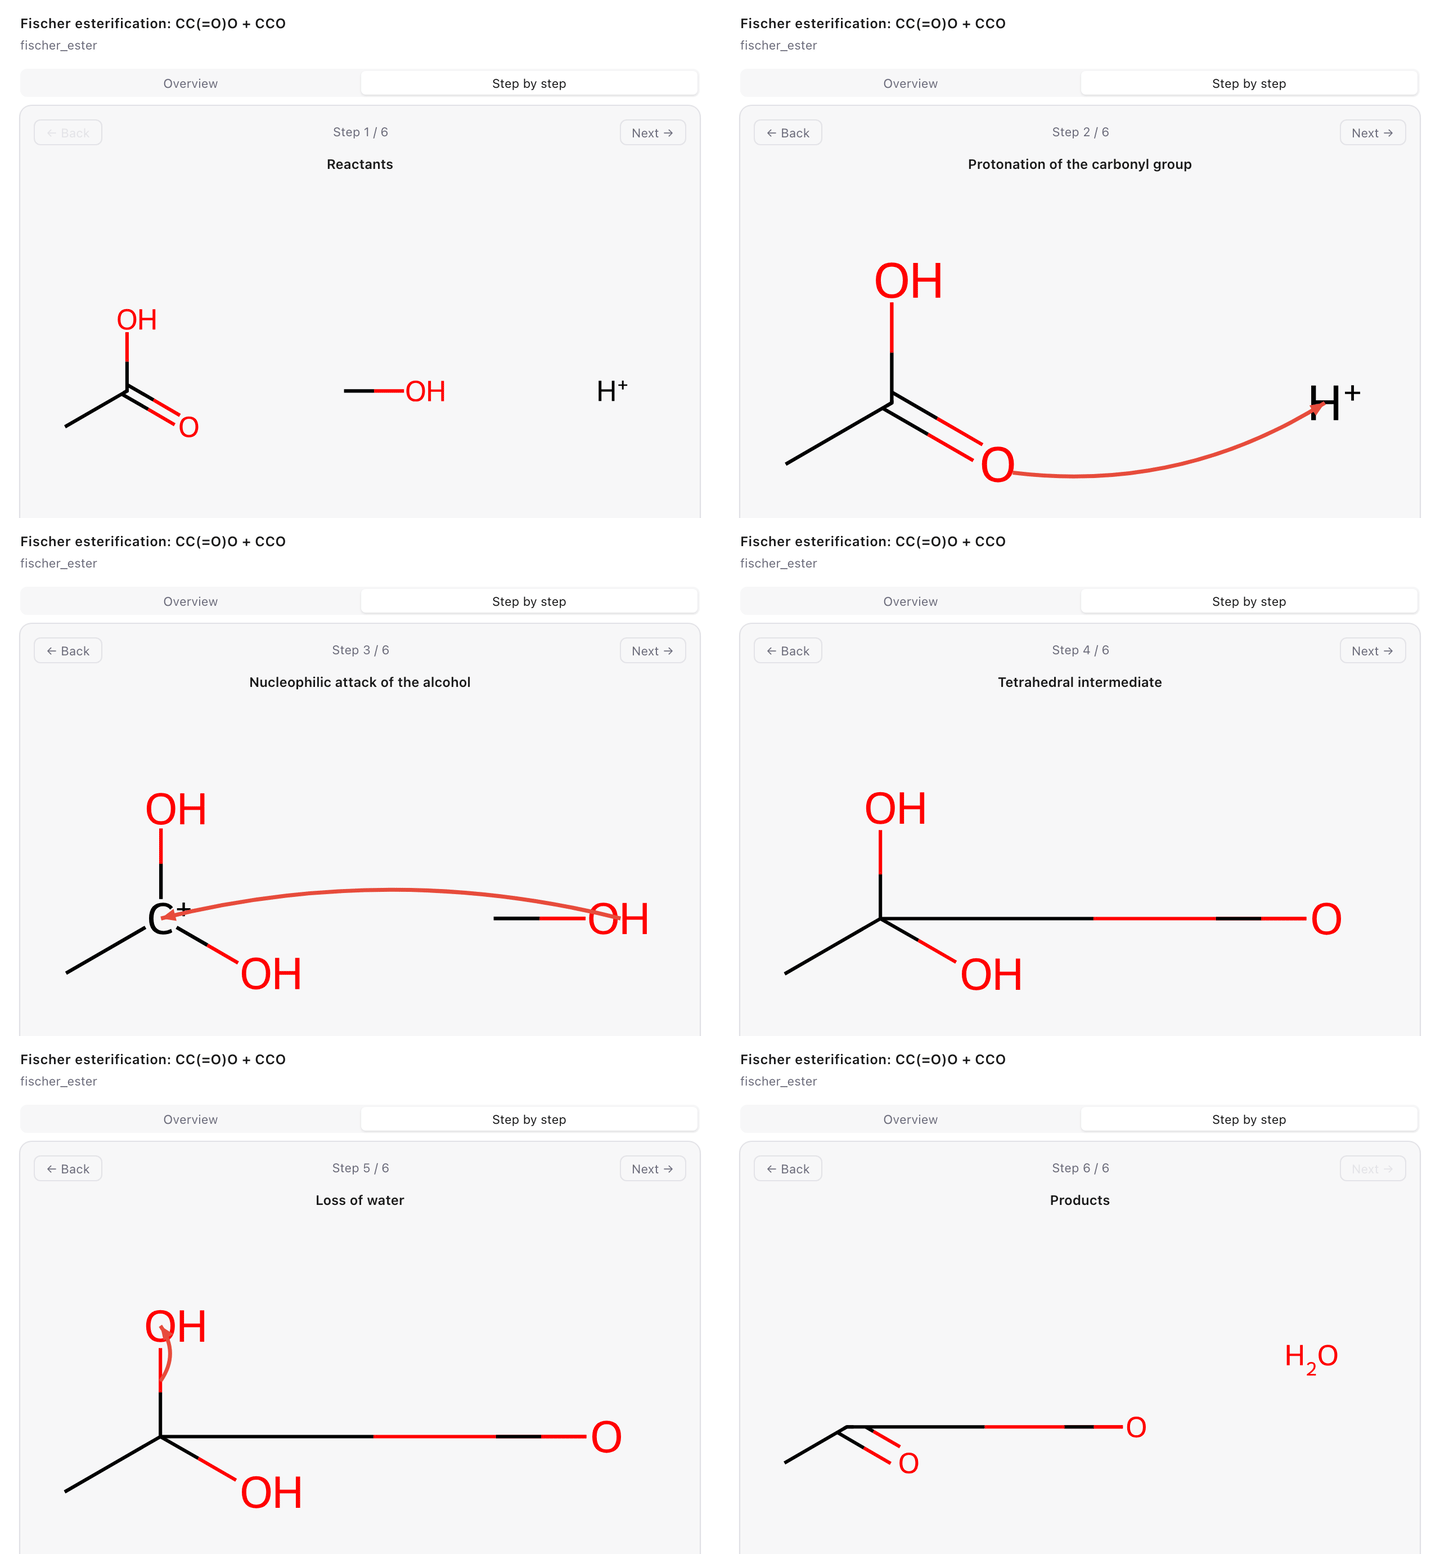
"Show the Fischer esterification mechanism step by step" —
generate_mechanism renders curved electron-flow arrows in the interactive
panel:
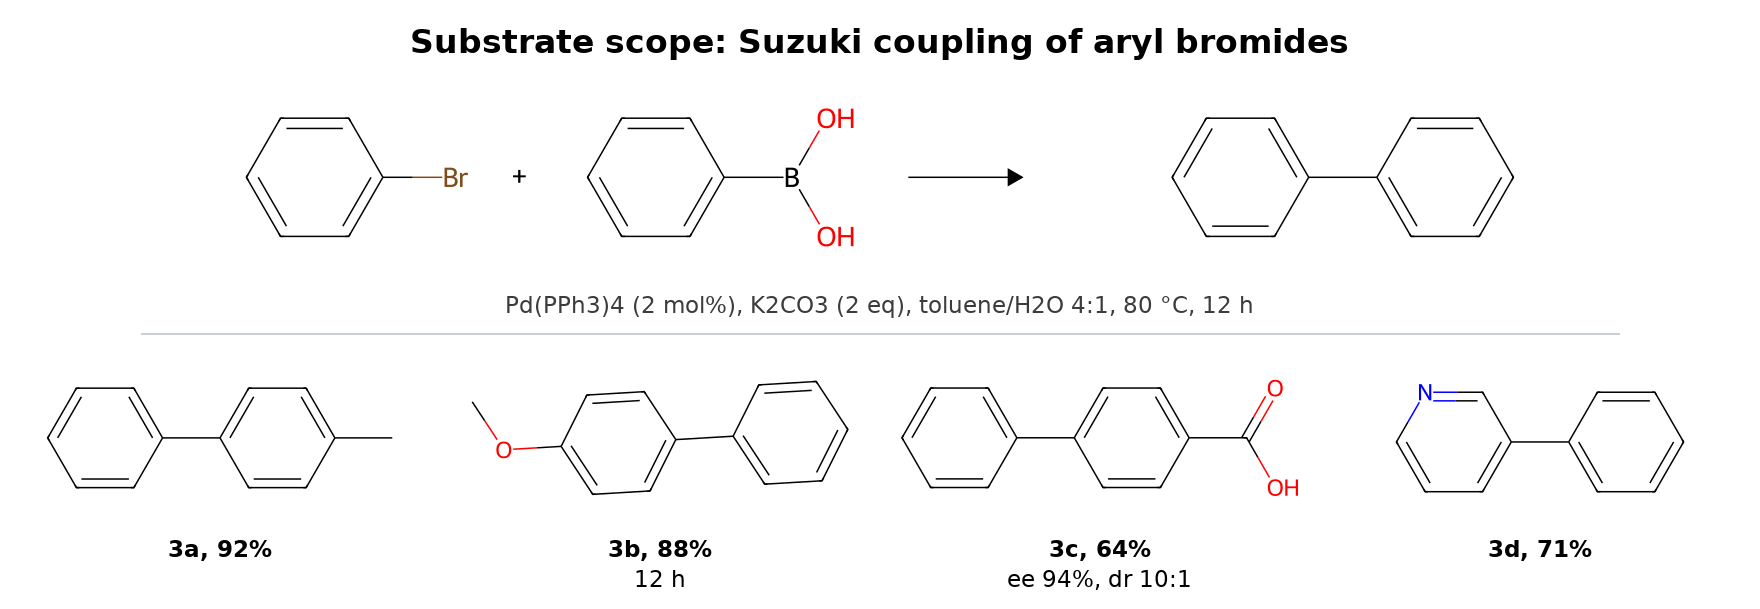
"Make a scope figure of my Suzuki couplings: 3a 92%, 3b 88% after 12 h,
3c 64% with ee 94% and dr 10:1, 3d 71%" — generate_scope_table sets the
general equation with its conditions on top and the products below it, on a
shared bond length and a shared caption baseline:
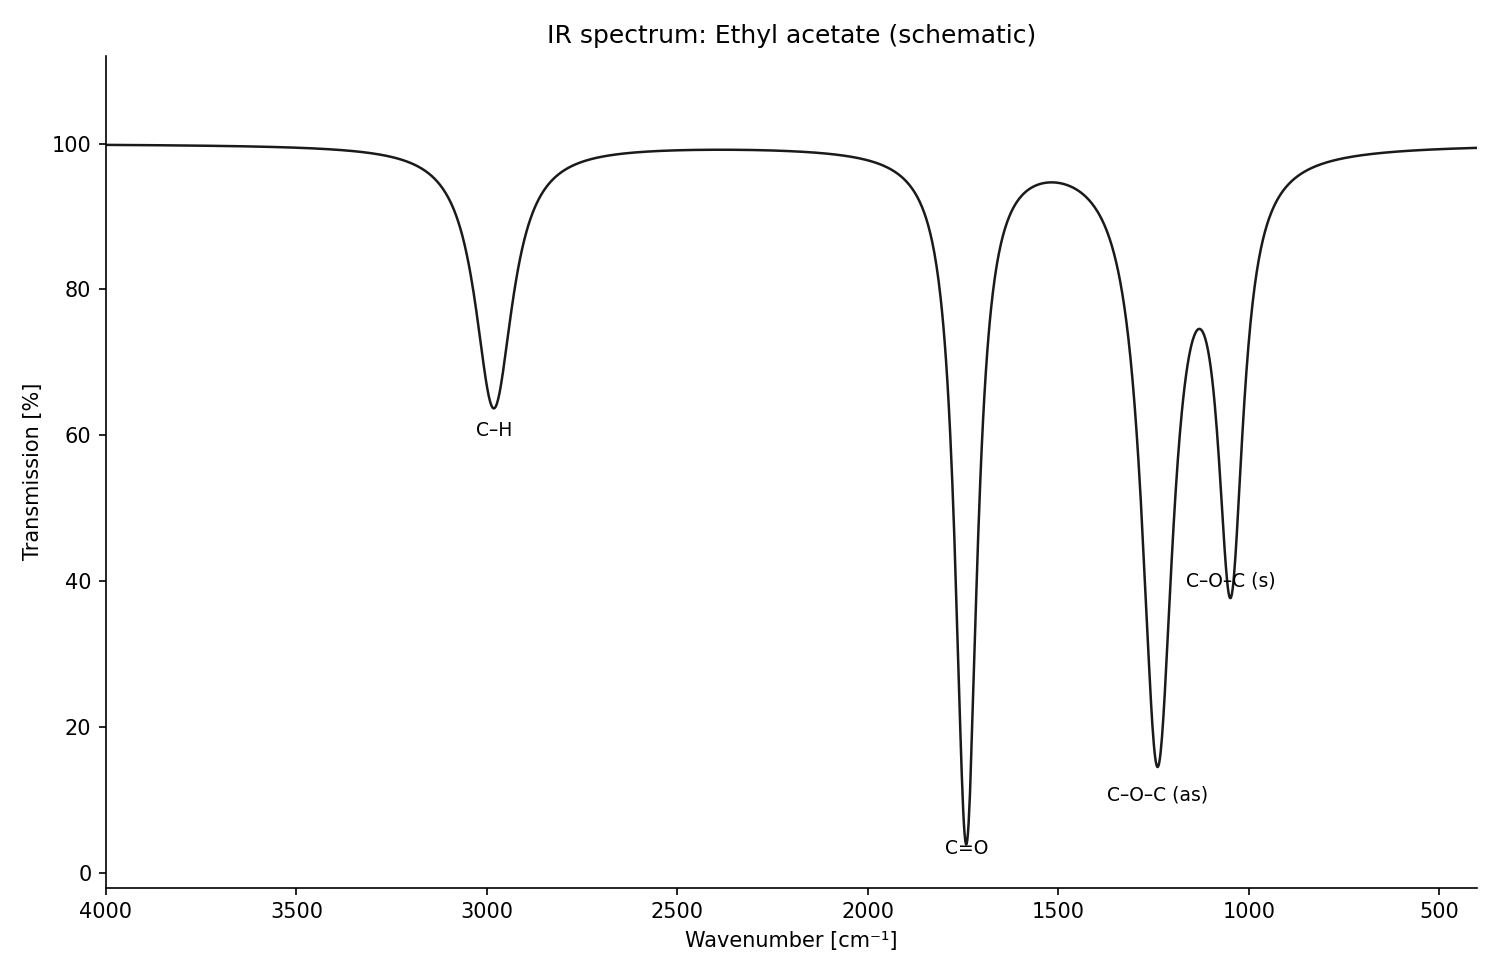
"Sketch the IR spectrum of ethyl acetate" — generate_spectrum (draws the
peaks it is given, with per-type axis conventions):
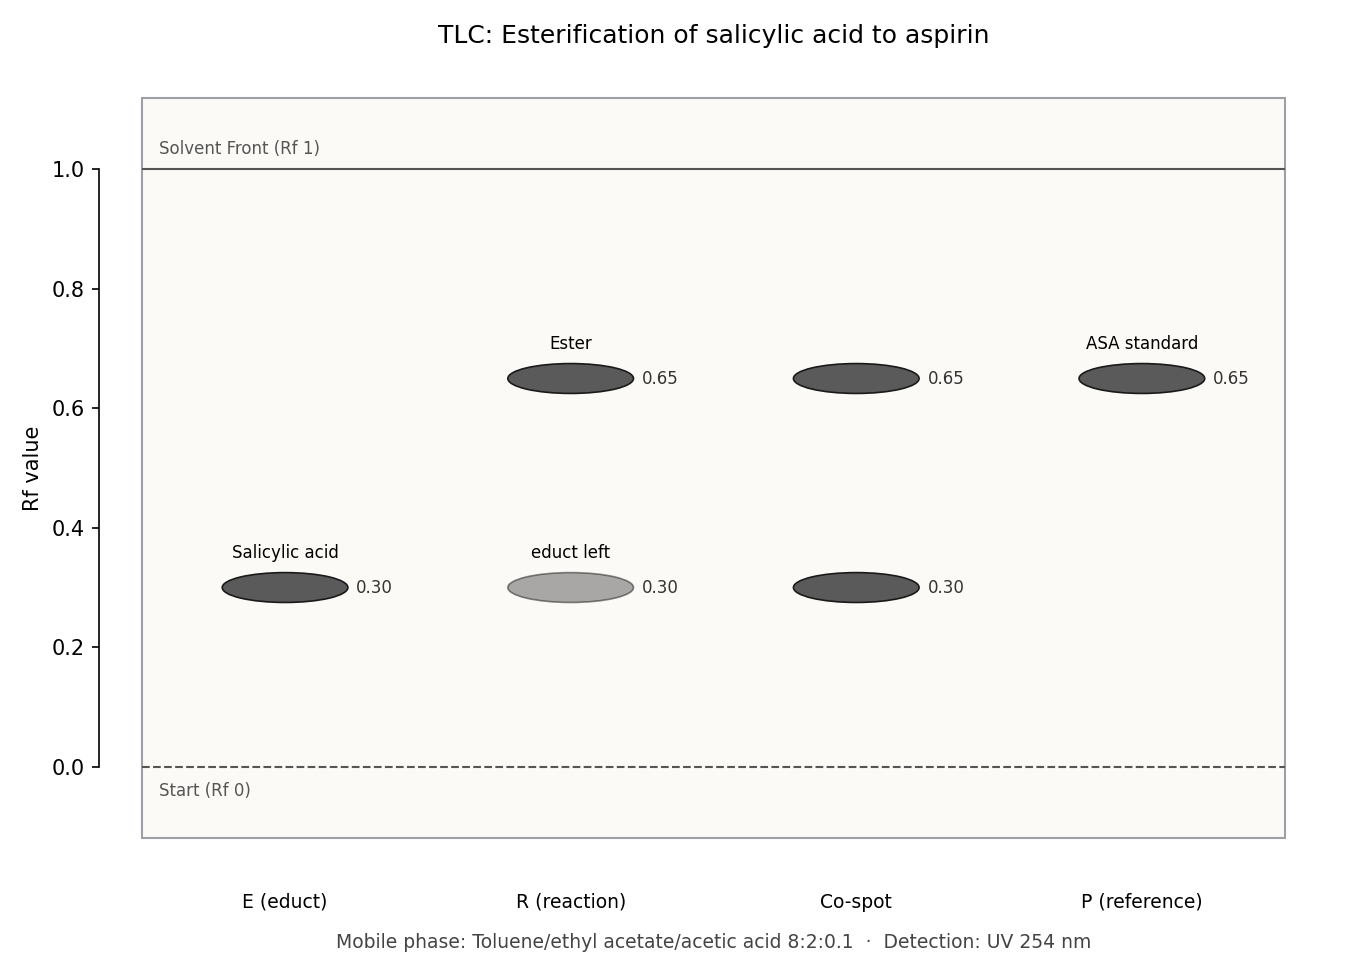
"TLC of my esterification: educt at 0.30, product at 0.65, the co-spot shows
both, some educt left" — generate_tlc draws the plate the lab report asks
for, with mobile phase and detection as its caption:
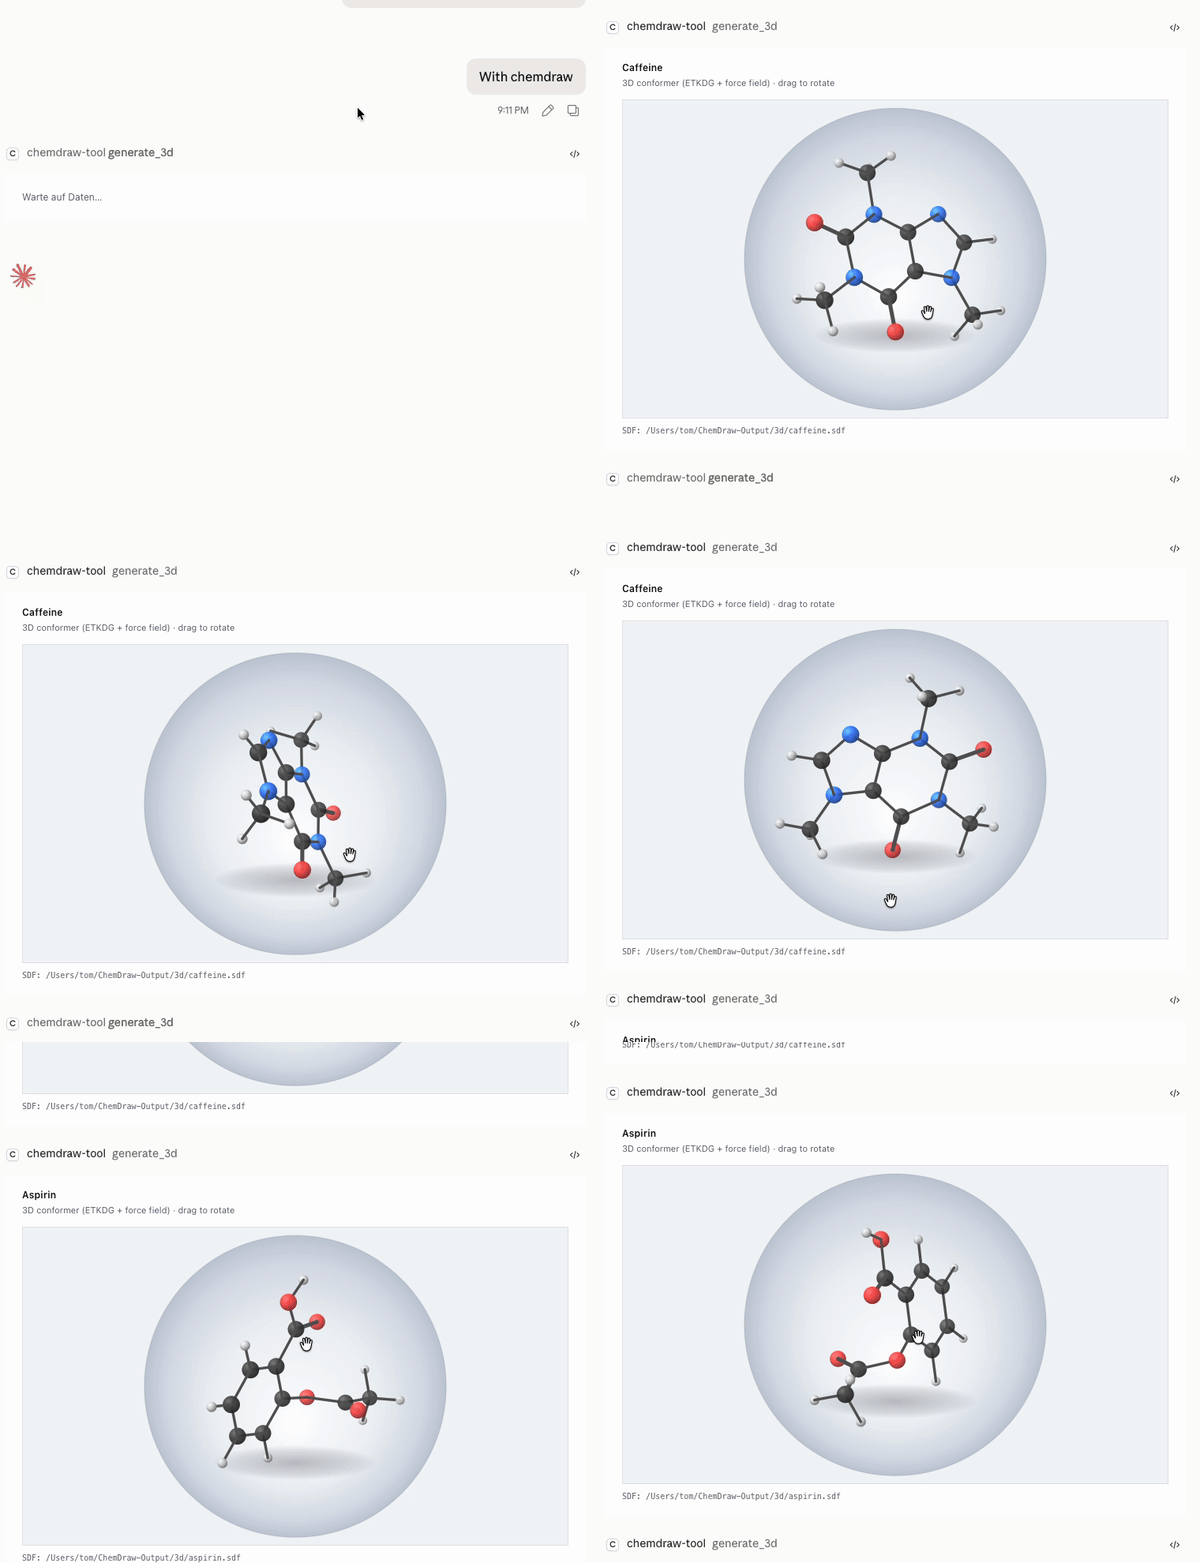
"Show caffeine in 3D" — generate_3d embeds the molecule (ETKDG + force
field) and opens a drag-to-rotate ball-and-stick viewer in the chat panel:
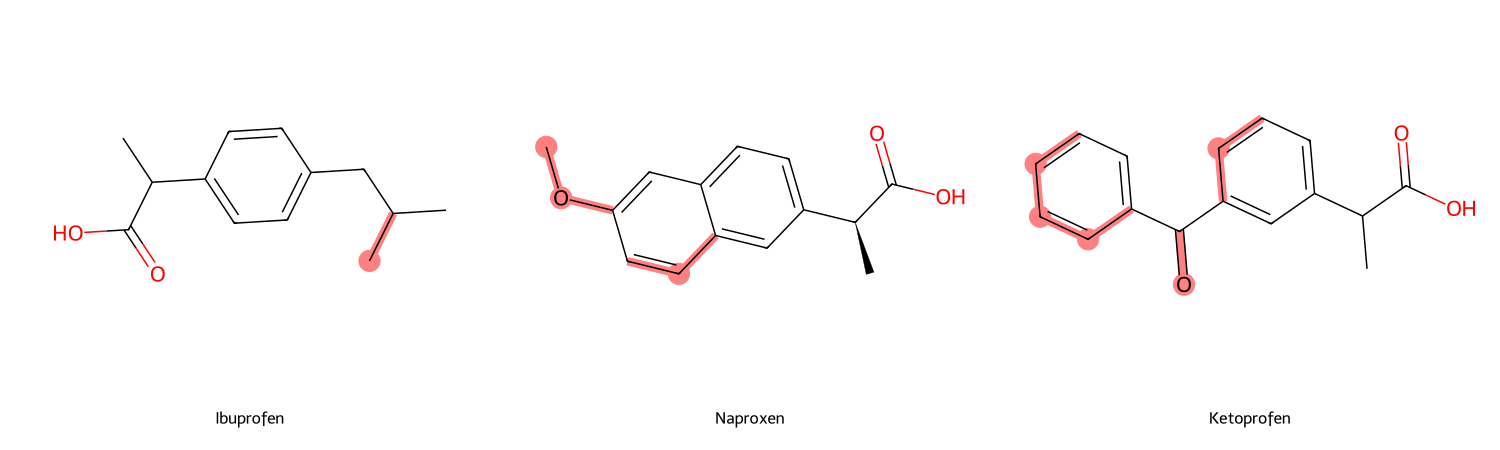
"What distinguishes ibuprofen from naproxen and ketoprofen?" —
compare_molecules keeps the shared scaffold (MCS) neutral and highlights
everything that differs:
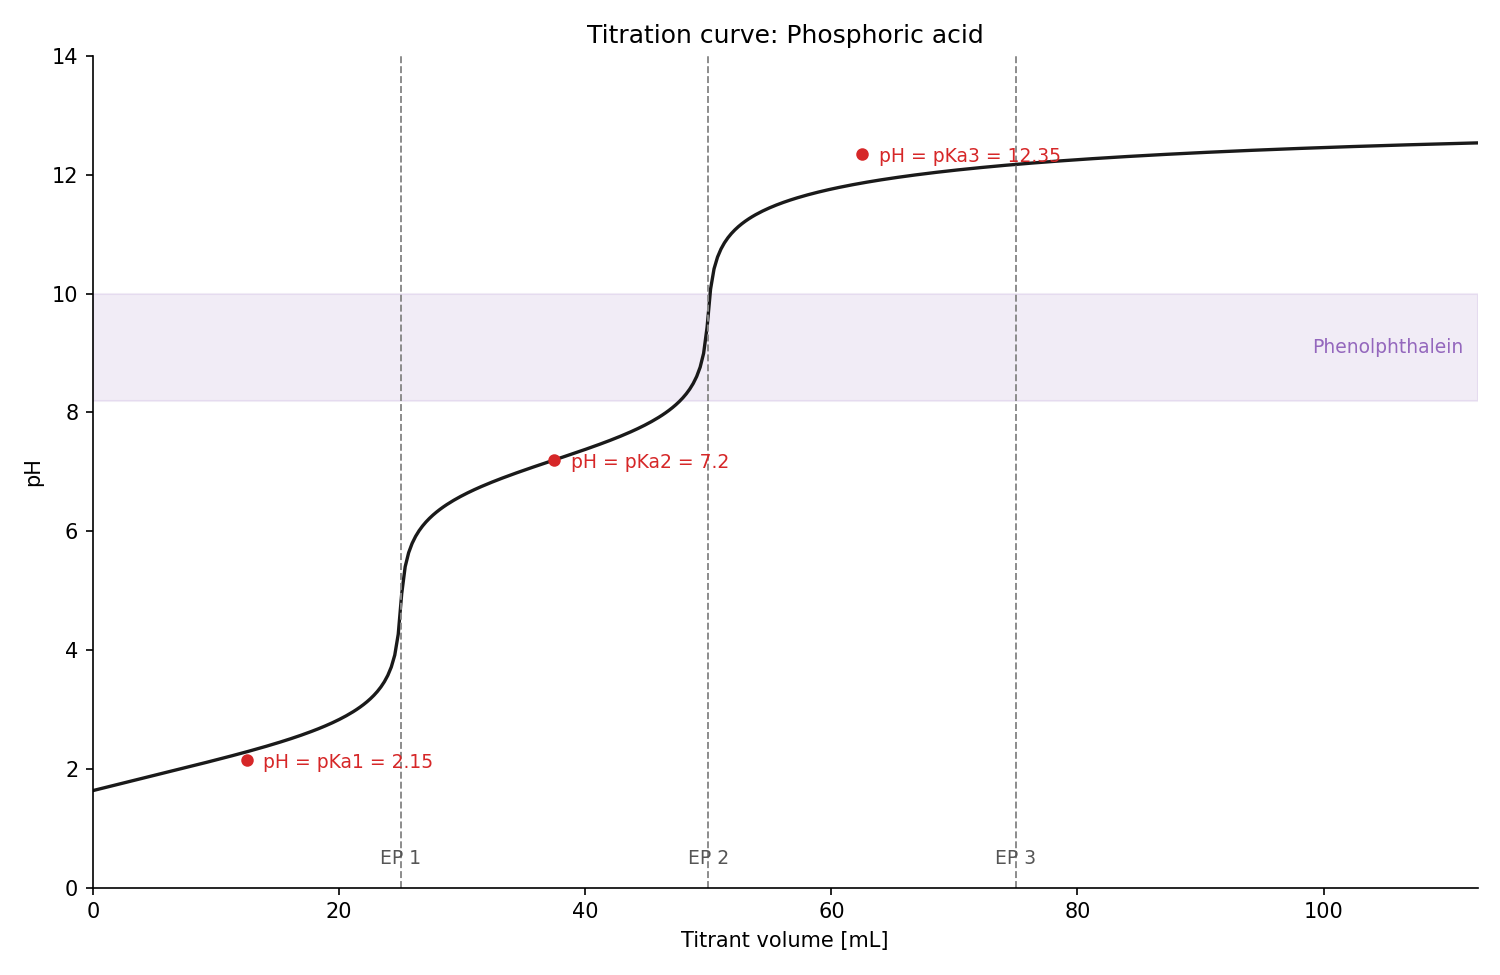
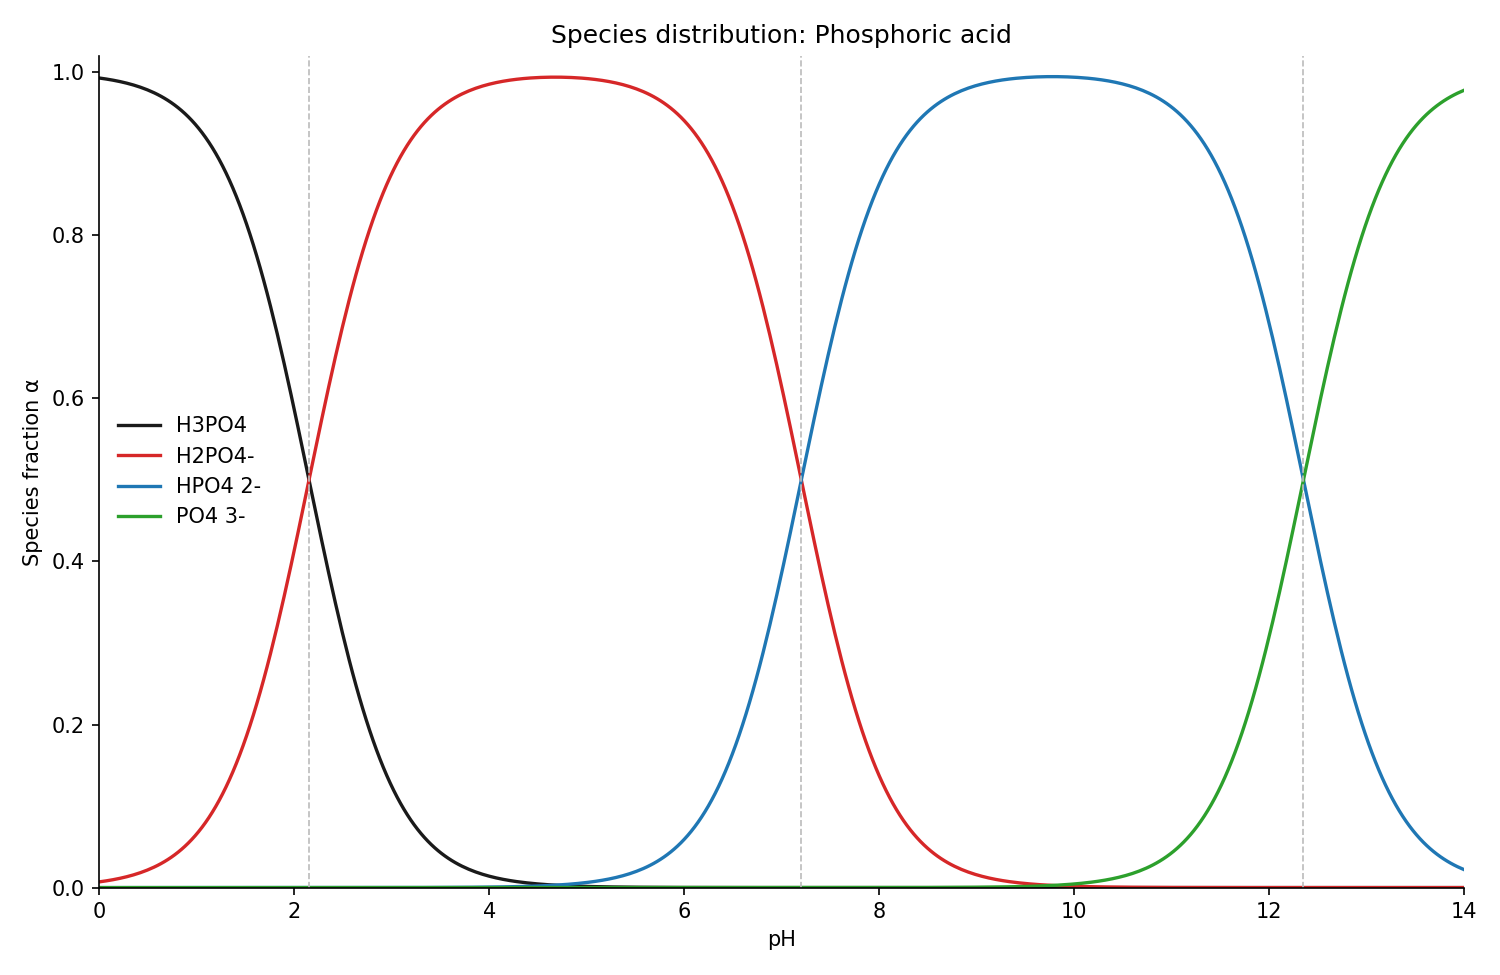
"Titration curve of phosphoric acid with NaOH, phenolphthalein as
indicator" — generate_titration_curve computes pH from the exact charge
balance, with equivalence points, buffer points (pH = pKa) and the indicator
band; its sibling generate_species_distribution shows which protonation
species dominates at every pH:
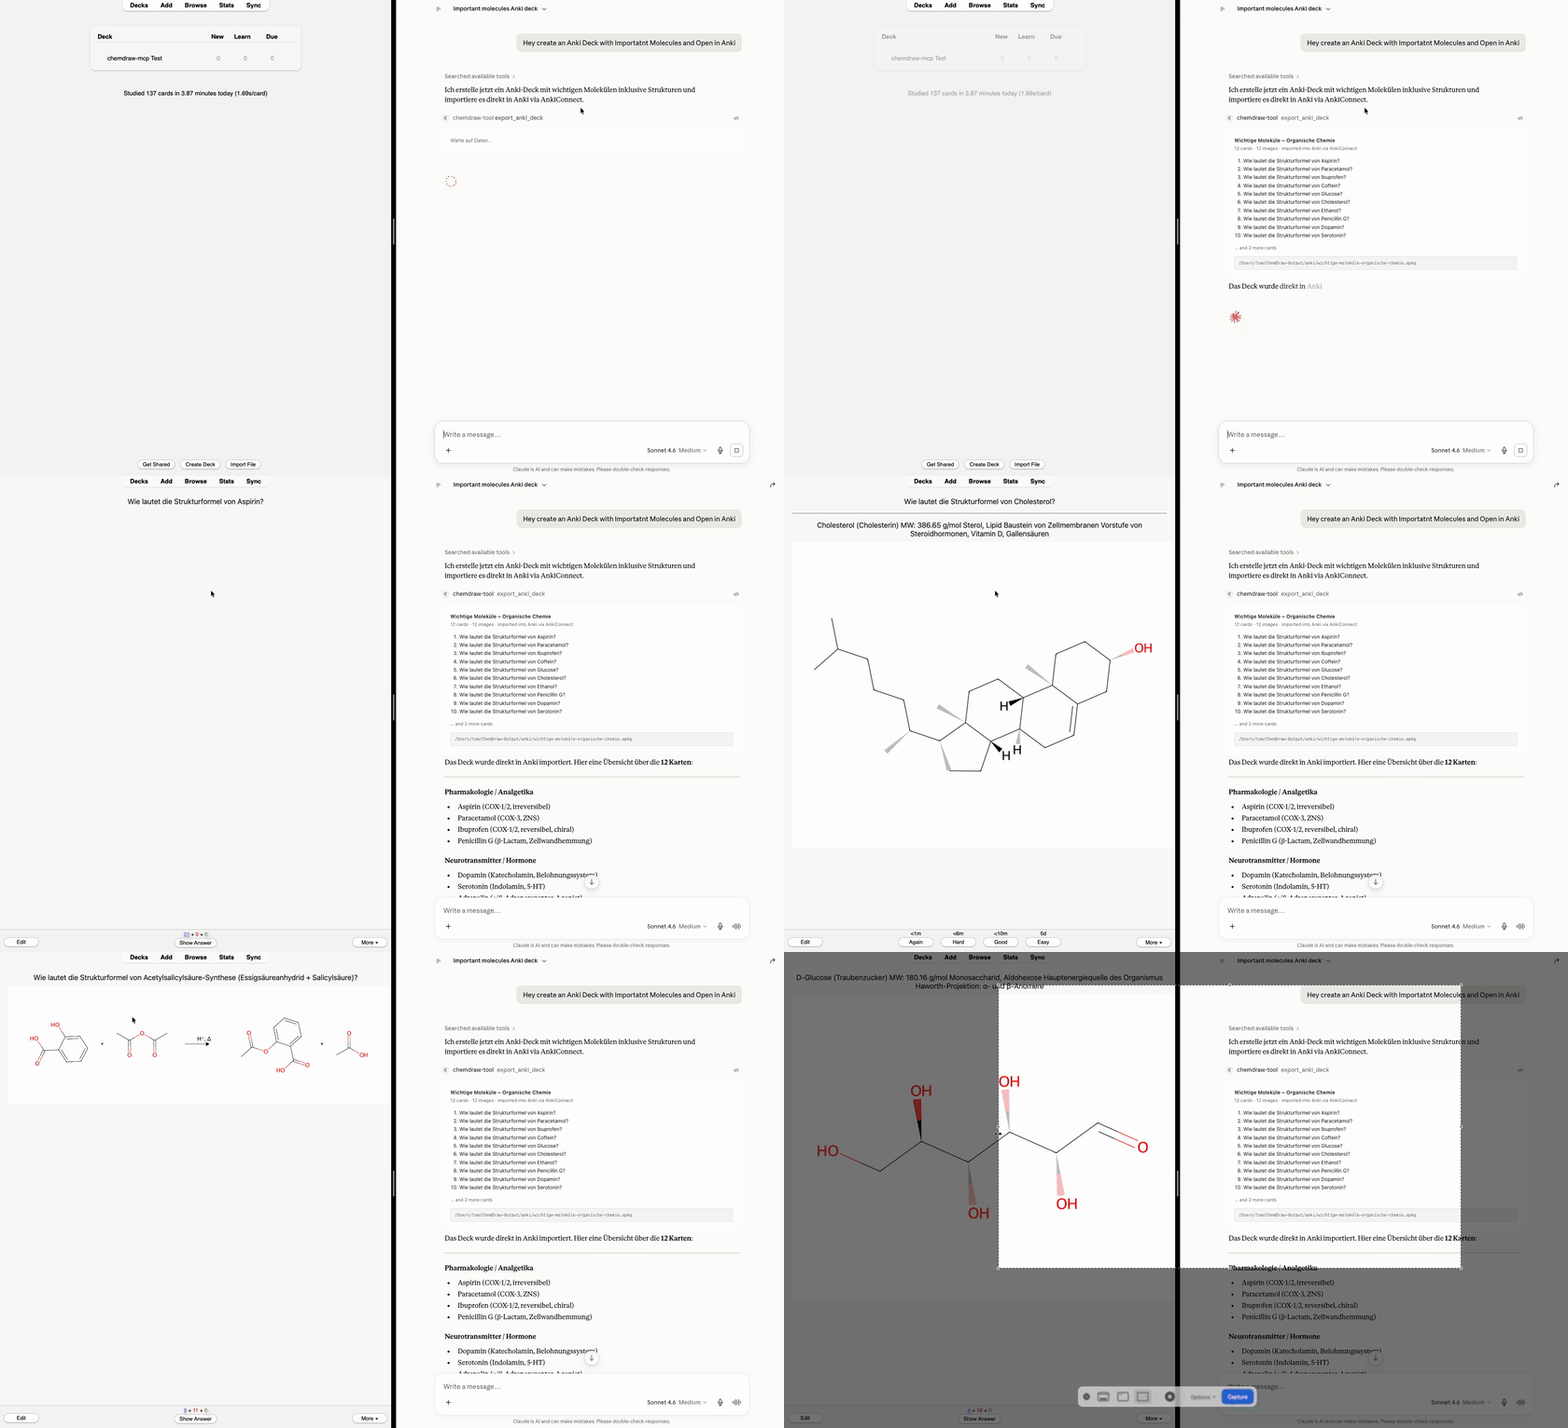
"Create an Anki deck with important molecules and open it in Anki" —
export_anki_deck builds a ready-to-import .apkg
with rendered structures embedded; with the optional AnkiConnect add-on the
cards land straight in the running Anki, no clicks:
Features
All 20 tools the server exposes. Files are written to ~/ChemDraw-Output/;
every drawing tool also returns a live preview for the in-chat panel.
Structures and schemes
generate_molecule— name/SMILES → 2D structure as PNG + SVG (optionally CDXML), with properties, functional-group detection and a Lipinski rule-of-five checkbatch_generate— a whole list of structures in one callgenerate_reaction— educts + products + conditions → reaction scheme with the conditions set above the arrowgenerate_mechanism— curved-arrow mechanisms (SN1, SN2, Fischer esterification) step by stepgenerate_scope_table— the substrate-scope figure of the methodology literature: the general equation with its conditions on top, below it a grid of products, each with identifier ("1a") and yield ("78%") plus optional ee/dr/time. All structures share one bond length, all captions one baseline; an entry that cannot be resolved is reported, not fatalcompare_molecules— 2–4 structures side by side, differences highlighted, shared scaffold (MCS) neutralgenerate_3d— rotatable 3D ball-and-stick conformer in the chat panel (ETKDGv3 + force field) plus SDF export
Lab results and analysis
generate_spectrum— schematic spectra from peak lists (IR, NIR, Raman, UV/Vis, fluorescence, ORD, CD, ¹H/¹³C NMR, MS) with per-type axis conventions — draws given peaks, does not predict spectragenerate_tlc— TLC plate sketch from Rf values: start line at the bottom, solvent front at the top, one captioned lane per application point (educt / reaction / co-spot), Rf annotated at every spot, mobile phase and detection printed as a caption — the sketch a lab report asks forgenerate_titration_curve— pH vs. titrant volume from the exact charge balance, with equivalence points, buffer points (pH = pKa) and indicator transition bandgenerate_species_distribution— protonation species fractions over pH (Henderson–Hasselbalch) with pKa crossovers markedgenerate_calibration_curve— least-squares line through your standards, and the unknowns read back off it the way you would with a ruler. A sample outside the calibrated range is labelled as extrapolated rather than quietly reported; limits of detection and quantitation (DIN 32645) come along for the validation question
Bench maths (the number and the working — a lab report asks for both)
calculate_solution— what to weigh (m = c · V · M), what you actually got, dilutions (C₁V₁ = C₂V₂ with the solvent volume spelled out), the mixing cross, and molar masses including hydrates likeCuSO₄·5H₂O. Warns when the calculated portion falls below what an analytical balance resolves — then diluting a larger portion is the right movecalculate_content— a content determination the way the protocol wants it: one content per measurement → Grubbs outlier test → mean, s, RSD → t-test against the declared content. Titration (with titer determination from reference titrations) and photometry, plus the fat characteristics (acid, saponification, ester and iodine value) and Karl Fischer water content as furthermethodscalculate_ph— weak and strong acids and bases, buffers, and buffer recipes down to weighable masses. Solved through the exact charge balance with the textbook approximation printed beside it: where the two disagree, the approximation has lost its assumptions and says so. 10⁻⁸ M HCl comes out at pH 6.98, not 8
Substance data (online lookups)
lookup— the facts as text, onetopicper question:properties(formula, mass, CAS, InChIKey — the default),safety(GHS hazard statements, pictograms, signal word),physical(melting/boiling point, solubility, density),biochem(ChEBI classification plus related UniProt entries),pathway(metabolic pathways from KEGG)lookup_molecule_data— PubChem + GHS combined into one data sheet for the in-chat panel, structure includedpredict_spectrum— which IR bands a structure should show (with intensity and band shape), what a measured wavenumber could belong to, and how many ¹H signals to expect with their integral ratio. Deterministic, so it says what it cannot do: no chemical shifts in ppm, and diastereotopic protons are counted as one signal
Exam prep
export_anki_deck— flashcards as a ready-to-import Anki.apkg: structure↔name drills (optionally reversed: one note, both directions), cloze/fill-in-the-blank cards, identity/detection reactions, spectrum band assignment — with rendered images embedded, per-card tags,Parent::Childsubdecks; re-exporting a deck updates cards instead of duplicating them. Optional delivery straight into the running Anki via the AnkiConnect add-on. Passcurated_deck_idinstead of your own cards for a small, formula-verified starter deck (classic analgesics, Ph.Eur. identity reactions)
Every tool belongs to one of five areas — draw, lab graphics, look up,
calculate, Anki — and each says what it is not for, in both directions, so
"draw aspirin" cannot end up in a substrate-scope grid and "what pH is my
buffer?" cannot end up in a plotting tool. One tool sits outside them: save_png is the
server half of the panel's export button, called when you click it, never
on its own.
Two optional vault tools (search_vault, read_vault_entry) appear only
when CHEMDRAW_VAULT_PATH is set; without it the server exposes exactly the
20 tools above.
Options on the drawing tools
formats—["png","svg"]by default;"cdxml"on top of that forgenerate_molecule,generate_reactionandbatch_generate. The figure tools (generate_scope_table,generate_tlc,generate_spectrum) reject CDXML with a clear error instead of writing something meaningless.abbreviate_groups=True— draws common substituents as the labels chemists actually write: Ph, Bn, OMe, OAc, tBu, CO₂H, Boc, Ts, TBS. Worth it whenever cells get small — a scope figure stays readable because only what differs between the substrates remains spelled out. Available ongenerate_molecule,generate_reaction,generate_scope_table,batch_generate.render_style— a named look instead of a pile of render parameters, on the same four tools."compact"(thin bonds, capped label size, tight margins) for a small figure in a two-column layout,"presentation"(double bond width, minimum font size, more padding) for a lecture slide,"grayscale"for black-and-white printing, where red and blue would otherwise become two indistinguishable greys. Empty means the default look, untouched.annotate_stereo=True— prints CIP descriptors (R/S, E/Z) on the 2D drawing (generate_molecule,batch_generate).
Installation
Three ways in; pick one. Options 1 and 2 merge into the config idempotently, back it up first and leave every other MCP server you have configured untouched. Afterwards restart Claude Desktop and ask: "draw caffeine".
Option 1 — clone the repo (recommended if you want to read or change the code; installs uv if missing, syncs dependencies, registers the server):
Option 2 — from PyPI, no clone (needs uv):
chemdraw-install writes the Claude Desktop entry for you, using the
absolute path of the installed launcher, and prints the start command it
registered.
Option 3 — edit the config by hand. Add this to
claude_desktop_config.json under mcpServers (macOS:
~/Library/Application Support/Claude/claude_desktop_config.json):
The one pitfall that breaks every manual install: Claude Desktop does not start MCP servers from a login shell — it uses the minimal GUI PATH. A bare
"uvx"or"uv"cannot be resolved there, and the server fails to start without saying so. Always put the absolute path thatwhich uvxprints on your machine intocommand. Options 1 and 2 do this for you.
Optional extras
- A Java runtime (e.g.
brew install openjdk) lets OPSIN parse systematic IUPAC names offline — including ones no database indexes. Without Java the resolver simply continues with the PubChem/NCI online lookup. - The AnkiConnect add-on lets
export_anki_deckpush cards straight into a running Anki. Without it you get the.apkgfile and import it yourself. - ChemDraw (macOS) is never required: request
formats=["cdxml"]and open the file yourself if you want to keep editing there.
Something not working? Run the doctor
This is the first thing to try — it turns "the server does nothing" into a
named cause. It checks the six things that make the server look dead in the
chat (RDKit rendering, the Java/OPSIN runtime, the uv path, the Claude
Desktop entry, the name databases, the output directory) and prints, for
every problem, the exact command that fixes it. Three levels are
distinguished: [OK], [LIMITED] (works, but restricted) and [FAIL]
(broken); [NOTE] marks checks that simply do not apply, such as not having
Claude Desktop installed. The exit code stays 0 as long as the server is
usable, so it can run in scripts. (From a PyPI install the uv and Claude
Desktop checks report [NOTE] — they relate to the repo installer.)
Limitations
Stated up front, so nothing surprises you in a report:
- Java is optional, and that has a price. Without a JRE, OPSIN is skipped and names are resolved online via PubChem/NCI — so name lookups need an internet connection and only work for names those databases index. SMILES input never touches the network.
- Spectra are schematic.
generate_spectrumdraws the peaks it is handed, with the right axis conventions for the spectrum type. It measures nothing and predicts nothing — if the peak values came from the chat rather than from your instrument, verify them before they go into a report. - TLC intensity is a drawing hint. The optional
intensity(0…1) makes a spot fainter on the sketch. It is not densitometry and carries no quantitative meaning. - CDXML is a side path. It is written from the RDKit molecule and round-trip validated, but PNG/SVG are the primary outputs and the ones the pixel tests cover. CDXML is off by default and limited to structures and reaction schemes — TLC plates, scope figures and spectra reject it.
- 3D is one conformer.
generate_3dembeds with ETKDGv3 and optimizes with MMFF (UFF as fallback). That is a plausible geometry for looking at, not a conformational search and not an energy statement. - The ChemDraw bridge is macOS-only and needs a locally installed ChemDraw. Everything else works without it.
How it works
Development
Python 3.11+, package manager uv.
600+ tests, written test-first. The e2e test rasters a real RDKit SVG in headless Chromium and compares it against an exact pixel snapshot — the export path and the in-chat preview are held to the same drawing constants.
License
Apache-2.0 — see LICENSE. Copyright 2026 jurimaxam-dotcom.
Disclaimer: This is an unofficial, independent project, not affiliated with or endorsed by Revvity. ChemDraw is a trademark of Revvity Signals Software, Inc. This tool does not include or require ChemDraw; it can optionally export files in the open CDXML format.