Create interactive visualizations and query data sources (SQLite, CSV, Parquet, JSON)
Quick Install
Automated & IDE SetupCopy the AI prompt to install this server into Claude Code, Cursor, or another agent — or use 1-click editor setup below.
Manual Client & Custom JSON ConfigExpand JSON ▾
Client Config & Setup
Choose your client or environment
Target File:
💡 Paste the JSON block into your client's configuration file under mcpServers, then restart the application.
Documentation Overview
Chart Canvas MCP Server
Interactive visualization dashboard for AI assistants via Model Context Protocol
Create beautiful charts, diagrams, and tables directly from your AI conversations. Chart Canvas provides a real-time dashboard that displays visualizations as you work with LLMs like Claude.
Demo
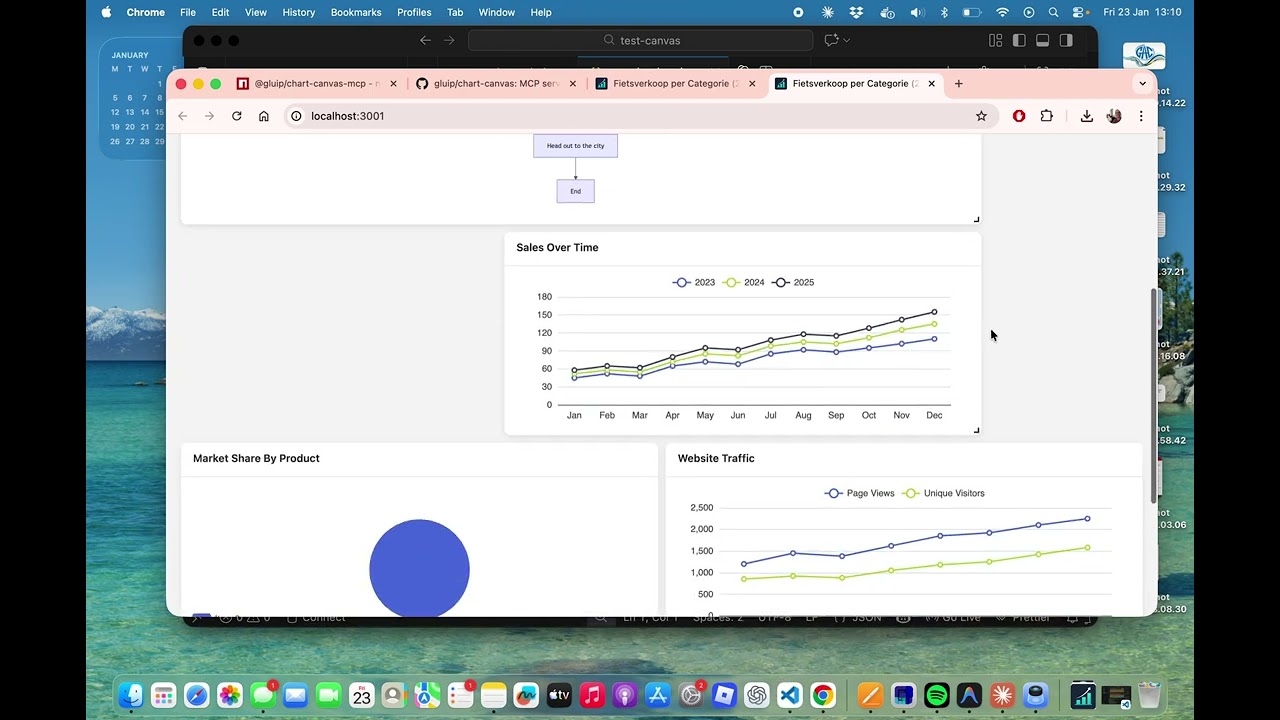
Watch the full demo on YouTube to see Chart Canvas in action!
Features
✨ Multiple Chart Types: Line, bar, scatter, pie charts, tables, and Mermaid diagrams
🎨 Interactive Dashboard: Drag-and-drop grid layout with real-time updates
🔄 Live Synchronization: Changes appear instantly in your browser
📊 Rich Visualizations: Powered by ECharts and Mermaid
💾 Universal Data Sources: Query SQLite, CSV, Parquet, JSON, and NDJSON files directly
⚡ Smart Data Flow: Execute queries server-side - data stays local, never sent to LLM
🔒 Privacy First: Your data never leaves your machine
🚀 Easy Setup: One command to get started
🌐 Production Ready: Built-in production mode with optimized builds
Supported Data Sources
Chart Canvas can query and visualize data from multiple file formats:
- SQLite (
.db,.sqlite,.sqlite3) - Relational databases - CSV (
.csv) - Comma-separated values - Parquet (
.parquet) - Columnar storage format - JSON (
.json) - JSON arrays of objects - NDJSON (
.jsonl,.ndjson) - Newline-delimited JSON
Privacy & Performance: All queries execute locally on your machine using DuckDB. Query results are transformed into visualizations server-side - only metadata (chart configuration) is sent to the LLM, never your actual data. This makes it fast, scalable, and private.
Quick Start
Installation
Or use directly with npx (no installation needed):
Configuration
Add to your MCP client configuration (e.g., Claude Desktop):
macOS: ~/Library/Application Support/Claude/claude_desktop_config.json
Windows: %APPDATA%/Claude/claude_desktop_config.json
Usage
- Start your MCP client (e.g., Claude Desktop)
- The server will automatically start on port 3000
- Use the
showCanvastool to open the dashboard in your browser - Ask the AI to create visualizations!
Example Prompts
MCP Tools
addVisualization
Create charts, diagrams, and tables on the canvas.
Supported Types:
line- Line charts with multiple seriesbar- Bar charts for comparisonsscatter- Scatter plots for data distributionpie- Pie charts with labelstable- Data tables with headersflowchart- Mermaid diagrams (flowcharts, sequence diagrams, Gantt charts, etc.)
Example:
removeVisualization
Remove a specific visualization by ID.
clearCanvas
Remove all visualizations from the canvas.
showCanvas
Open the dashboard in your default browser.
getDatabaseSchema
Inspect the structure of a SQLite database to understand available tables and columns before writing queries.
Parameters:
databasePath- Path to SQLite database file (e.g.,./data/mydb.sqliteor absolute path)
Example:
Returns: Formatted schema showing all tables, columns, data types, and constraints.
queryAndVisualize
Execute a SQL query on a SQLite database and create a visualization from the results. Queries are executed server-side and must be read-only (SELECT only). Maximum 10,000 rows.
Parameters:
databasePath- Path to SQLite database filequery- SQL SELECT query (read-only)visualizationType- Type of chart:line,bar,scatter,pie, ortablecolumnMapping(optional for table) - Mapping of columns to chart axes:xColumn- Column for X-axis (required for charts)yColumns- Array of columns for Y-axis (required for charts)seriesColumn- Column to group data into separate series (optional)groupByColumn- Alternative grouping column (optional)
title- Optional title for visualizationdescription- Optional descriptionuseColumnAsXLabel- If true, use X column values as labels instead of numbers
Example:
Security: Only SELECT and WITH (CTE) queries are allowed. INSERT, UPDATE, DELETE, DROP, and other modifying operations are blocked.
Architecture
- Backend: Node.js + TypeScript + Express + MCP SDK
- Frontend: Vue 3 + ECharts + Mermaid + Grid Layout
- Communication: Real-time polling for instant updates
Development
Local Development
MCP Configuration for Local Development
License
MIT © 2026 Martijn
Links
Related MCP Servers
Reviews
No reviews yet — be the first to share how this listing worked for you.
Frequently Asked Questions about Chart Canvas
AllMCPs Directory Badge
Showcase your server listing on GitHub or your project documentation. Embed this dynamic SVG badge to highlight official listing status and live engagement.
Badge Style:
Live Dynamic SVG Preview
Markdown (GitHub README)
[](https://allmcps.com/mcp/chart-canvas)HTML Embed
<a href="https://allmcps.com/mcp/chart-canvas"><img src="https://allmcps.com/api/badge/chart-canvas?style=directory" alt="Chart Canvas on AllMCPs" /></a>Technical Specs & Signals
CategoryDatabases
27Quality signal: Emerging · 27/100How this signal is calculated ▾
Server availabilityNot measured
Not scored for repo-hosted servers — we can't reach the running server, only its GitHub page. Hosted MCP endpoints are health-checked live.
Verified ownership8/20
Documentation & tools11/30
Adoption & activity1/15
Community engagement0/10
A guidance signal from public completeness & health data — not a user rating. New listings start lower and rise as they add docs, get verified, and grow adoption. Signals we can't observe for a listing are skipped, not counted against it.
Own this project?
This directory is pre-filled from public sources. Claim via GitHub README, site badge, or DNS TXT to unlock edit access and the Official badge and attach your website — proof is checked automatically, then reviewed by our team.
Free dofollow backlink: add your website and place the AllMCPs badge on it — no claim needed. We detect it automatically and keep it verified as long as the badge stays live.
Claim & get free dofollowShare & Embed
Add our SVG badge (dark/light directory styles) or embeddable widget to your site.