Excalidraw Architect MCP README
The full upstream README, mirrored here for reference. Install config, tool schemas, adoption signals, and an original overview live on the Excalidraw Architect MCP listing page.
Excalidraw Architect MCP




Every diagram your engineering docs need — as hand-drawn Excalidraw, generated by your AI.
Twenty-five diagram types. Architecture and flowcharts, but also sequence diagrams, state machines, ER models, swimlanes, timelines, Gantt charts, quadrants, funnels, and hand-sketched bar/line/scatter charts. No coordinates to hallucinate, no Figma, no stale PNGs.
The Problem
When you're onboarding onto a codebase, designing a new system, or documenting how something works, a diagram communicates in seconds what pages of text can't. But the options aren't great.
Mermaid is quick to generate and locked down — you can't drag a node, group things visually, or annotate it afterwards. Figma means thirty minutes of manual work per picture. And when an LLM writes Excalidraw JSON directly it hallucinates coordinates: boxes overlap, arrows tangle, and you fix it by hand.
Worse, most tools only cover one diagram type well. The moment your doc needs a sequence diagram next to the architecture sketch, you're switching tools and the two look nothing alike.
The Solution
excalidraw-architect-mcp separates the what from the where — the AI describes structure, the engine does the pixel math.
Your LLM says what the components, actors, tiers, or data points are. The MCP picks the layout algorithm for that diagram type, styles it, and writes a real .excalidraw file you can open and keep editing. 50+ technologies (Kafka, PostgreSQL, Redis…) get auto-styled, every diagram can be revised in natural language, and it runs fully offline in Cursor/Claude Code/Windsurf — no API keys.
- 25 diagram types, one grammar — see them all, from architecture to Gantt to scatter plots
- Genuinely hand-drawn output — a pure-Python port of the roughjs stroke generator, so exported SVG/PNG looks like the Excalidraw canvas, not a clean-geometry approximation
- Perfect layouts every time — Sugiyama with adaptive spacing for graphs; purpose-built geometry for everything else
- Architecture-aware styling — say "Kafka" and get a stream-styled node, not a generic rectangle
- Talk to your diagrams — add, remove, or rewire any diagram in natural language; the spec lives in the file
- Export to SVG & PNG — no browser, no Node.js
- Living architecture knowledge graph — optionally persist your system as a version-controlled model the AI can query and lint (details)
📐 25 Diagram Types
Every image below is a real
.excalidrawfile generated by this MCP — zero manual positioning. Click any one to see it full size.
 Architecture Components + connections |  DP integration Sources → core → consumers |  Sequence Messages over time |
 Timeline Events on an axis |  Gantt Tasks and phases |  Quadrant Two-axis positioning |
 Pyramid / funnel Ranked tiers or drop-off |  Venn Set overlap |  Loop Flywheel around a hub |
 Bar chart Categorical comparison |  Line chart Trends over time |  Scatter plot Distribution + correlation |
 Nested Hierarchy by containment |  Layer stack Stacked abstractions |  Medallion Data quality tiers |
 ER / data model Entities + fields |  High-level Stack inside a boundary |  IT current-state Legacy landscape |
 Swimlane Cross-functional flow |  Process Multi-actor workflow |  Data flow Role-scoped pipeline |
 Flowchart Decision logic with branches |  Tree Parent → children |  Org chart Ownership + escalation |
 State machine States + transitions |
Choosing and calling
The gallery above is ordered by how often you'll reach for each type. Internally they fall into five families, which is what decides the layout engine:
| Family | Types |
|---|---|
| Graph | architecture · flowchart |
| Structural | tree · org_chart · state · nested · layers · medallion · er · high_level · it_state |
| Flow | swimlane · process · data_flow · dp_integration · sequence |
| Geometric | timeline · quadrant · pyramid (+ funnel) · venn · loop · gantt |
| Charts | bar · line · scatter |
architecture and flowchart are graphs and take nodes + connections. Every other type takes a diagram_type and a spec shaped for it:
Call list_diagram_types() for when-to-use guidance on each, and get_diagram_schema("<type>") for the exact spec shape. Or just ask: "draw the PR review flow as a swimlane".
Two conventions worth knowing. Mark one or two elements "focal": true — that earns the accent color, and marking five spends the signal. And chrome (axes, gridlines, lane dividers) deliberately renders crisp while shapes and data marks render hand-drawn; that contrast is what keeps a sketchy chart legible instead of noisy.
Editing works on every type. The validated spec is stored inside the .excalidraw file, so you patch it rather than rebuild it:
Lists are replaced wholesale — to change one tier, send the whole tiers list.
Regenerate every image above with python scripts/generate_showcase.py --png.
See It In Action
Every frame below is generated entirely by AI using this MCP - zero manual positioning.
E-Commerce Platform Architecture

Payment Processing Flow

Use Cases
- Onboarding onto a new codebase — point it at a service and get a high-level architecture diagram without reading a line of code, then a sequence diagram for the one flow that matters.
- Design docs and RFCs — an architecture sketch, a state machine for the new lifecycle, a quadrant for the options you rejected, and a Gantt for the rollout. One tool, one visual language.
- Runbooks and incident write-ups — sequence diagrams for what happened, timelines for when, swimlanes for who did what.
- Data platform documentation — medallion tiers, role-scoped pipelines, integration topology.
- Reporting without a BI tool — hand-drawn bar/line/scatter charts that sit next to your architecture diagram instead of clashing with it.
- Documentation that stays alive — commit the
.excalidrawfile and revise it in natural language as the system changes. No more stale diagrams from six sprints ago.
Quick Start
Install
For PNG export support (SVG works out of the box):
Or run without installing (requires uv):
Configure MCP in Your IDE
Cursor - Add to .cursor/mcp.json:
Claude Code - Run this one-liner:
Or add manually to .mcp.json in your project root:
Windsurf / Other IDEs - Same pattern; point to the excalidraw-architect-mcp command over stdio.
Install the Excalidraw Architect Skill (recommended for the 25 types)
skills/excalidraw-architect/ teaches the AI which of the 25 types to pick and how much to put in one — the selection table, the density budget, the reserved-accent rule, and a worked example of every spec.
The same guidance also ships inside the server via list_diagram_types() and get_diagram_schema(), so Cursor, Windsurf, and Zed get it without installing anything — the skill just puts it in context up front instead of one call later. Both are generated from a single source (src/excalidraw_mcp/diagrams/registry.py); a test fails the build if they drift.
Install the Diagram Design Skill (recommended)
This repo includes a Diagram Design Skill that teaches the AI how to structure diagrams for the best results - node count limits, topology rules, edge label guidelines, and common patterns.
For Cursor users:
For other IDEs: Download the SKILL.md file and add it to your IDE's prompt context or system instructions.
The AI will automatically pick up the skill and apply it when generating diagrams. Feel free to modify the rules to suit your preferences - tweak node limits, add your own patterns, or adjust styling guidelines.
Install the Knowledge Graph Skill (recommended for the graph workflow)
For the architecture knowledge graph, this repo also includes an Architecture Knowledge Graph Skill. It teaches the AI how to read a codebase well — identify service boundaries, map communication signals (HTTP / gRPC / Kafka / DB) to the right labelled links, match producers and consumers across repos, and keep the graph clean (stable ids, every edge labelled, lint before render).
For Cursor users:
For other IDEs: Download the SKILL.md file and add it to your IDE's prompt context or system instructions.
A note on diagram complexity: As the number of components and connections grows, diagrams inevitably become harder to read - this is true for humans drawing by hand too, not just automated layout. For best results, aim for 6-15 nodes in architecture diagrams and 10-25 nodes in detailed flows. If your system is larger, split it into multiple focused diagrams rather than cramming everything into one.
Use It
Just ask your AI IDE naturally:
"Create a high-level architecture diagram of this codebase"
"Create an architecture diagram for a microservices system with an API Gateway, Auth Service, User Service, Order Service, PostgreSQL, Redis cache, and Kafka event bus"
"Convert this mermaid diagram to excalidraw diagram"
"Add a Caching layer to the Order Service in the High Level architecture diagram"
"Export the architecture diagram to SVG"
"Export the diagram as a PNG at 3x resolution"
The AI calls the MCP tool with the relationship map. The MCP handles layout, styling, and output. Open the resulting .excalidraw file with the Excalidraw VS Code extension or drag it into excalidraw.com.
Features
Auto Layout Engine
Uses the Sugiyama hierarchical layout algorithm with:
- Adaptive layer gaps - spacing adjusts based on edge label length
- Hub node stretching - gateways/load balancers stretch to span connected services
- Obstacle-aware edge routing - arrows curve around intermediate nodes instead of cutting through them
- Disconnected component stacking - separate subgraphs (e.g., monitoring stack) are placed without overlap
Component Library
50+ technology mappings with automatic visual styling:
| Category | Technologies |
|---|---|
| Database | PostgreSQL, MySQL, MongoDB, DynamoDB, Cassandra, ClickHouse, SQLite, CockroachDB |
| Message Queue | Kafka, RabbitMQ, SQS, Redis Streams, NATS |
| Cache | Redis, Memcached, Varnish |
| Load Balancer | Nginx, HAProxy, ALB/ELB, Traefik, Envoy |
| Compute | Docker, Kubernetes, Lambda, ECS, Fargate |
| Storage | S3, GCS, Azure Blob, MinIO |
| API | REST, GraphQL, gRPC, WebSocket |
| CDN | CloudFront, Cloudflare |
| Monitoring | Prometheus, Grafana, Datadog, ELK |
| Client | Browser, Mobile, Desktop, CLI |
Stateful Editing
Diagram metadata is embedded in the .excalidraw file. Ask the AI:
"Add a Redis cache in front of the database in the existing diagram"
The MCP reads the current state, applies the modification, and re-renders with proper layout.
Mermaid Conversion
Already have a Mermaid flowchart? Convert it:
"Convert this Mermaid diagram to Excalidraw" (paste your Mermaid syntax)
Image Export That Still Looks Hand-Drawn
Excalidraw's sketchy look is not stored in the file — it is produced at render time by roughjs, which redraws every shape as two jittered strokes seeded from the element. An exporter that emits a plain <rect> reproduces the geometry perfectly and the character not at all.
So this one ports the roughjs stroke generator to Python: same seeded PRNG, same line/curve/ellipse/fill routines. Exports match the canvas — doubled pencil strokes, overshooting circles, V-shaped arrowheads, and fills that sit slightly inside their outlines.
- SVG — zero extra dependencies, no browser, no Node.js
- PNG — requires the optional
cairosvgpackage (pip install excalidraw-architect-mcp[png]); configurable resolution multiplier (default 2×)
Chrome renders crisp on purpose. Axes, gridlines, and lane dividers are drawn at roughness: 0, because a 1px hairline with hand-drawn jitter is indistinguishable from noise.
Fonts. Excalidraw's Excalifont is a bundled webfont, so a standalone SVG has nothing to resolve it to. Exports name a stack of real handwriting faces (Excalifont → Virgil → Segoe Print → Bradley Hand → Chalkboard) instead of the generic CSS cursive, which on macOS resolves to the calligraphic Apple Chancery. For output that looks identical everywhere, pass a font file to embed it:
"Export the architecture diagram as an SVG"
MCP Tools
Diagram tools
| Tool | Description |
|---|---|
create_diagram | Create a diagram of any of the 25 supported types |
list_diagram_types | Every type with when-to-use / when-not-to guidance |
get_diagram_schema | Spec schema + worked example for one type |
mermaid_to_excalidraw | Convert Mermaid flowchart syntax to .excalidraw |
modify_diagram | Patch an existing diagram — nodes/connections, or the stored spec |
get_diagram_info | Read current diagram state (call before modifying) |
export_diagram | Export .excalidraw to SVG or PNG image |
Knowledge graph tools (kg_*)
Optional. For the architecture-documentation workflow only — the knowledge graph (default .claude/architecture.md) becomes the source of truth and diagrams become rendered views of it. See Architecture Knowledge Graph below.
| Tool | Description |
|---|---|
kg_init | Create a new knowledge graph file |
kg_add_service / kg_remove_service | Add/update or remove a service (with type, domain, owner, tags, links) |
kg_link / kg_unlink | Add/remove a dependency (parallel edges supported — e.g. REST and Kafka between the same pair) |
kg_set_domain | Group a service into a domain / bounded context |
kg_info | Summarize services, domains, and topology |
kg_render | Render the whole architecture to .excalidraw |
kg_render_view | Render a focused diagram of specific services |
kg_render_around | Render everything within N hops of a service |
kg_render_domain | Render a single domain |
kg_import | Bootstrap the graph from an existing .excalidraw diagram |
whats_connected_to | Impact analysis — upstream/downstream blast radius |
kg_path | Trace the dependency path between two services |
kg_lint | Health check: cycles, single points of failure, orphans, dangling refs |
kg_export | Export the graph to Mermaid, Graphviz DOT, or JSON |
kg_diff | Show how the architecture changed since a git ref |
kg_onboarding_doc | Generate a human onboarding guide from the graph |
kg_drift | Detect drift between the declared graph and Python imports |
🧠 Architecture Knowledge Graph
Optional, and only for architecture. Everything above works without it. But if you document one system repeatedly, a one-off diagram goes stale the moment you close it — so architecture diagrams can instead be views of a persistent, version-controlled model the AI builds once and reuses everywhere.
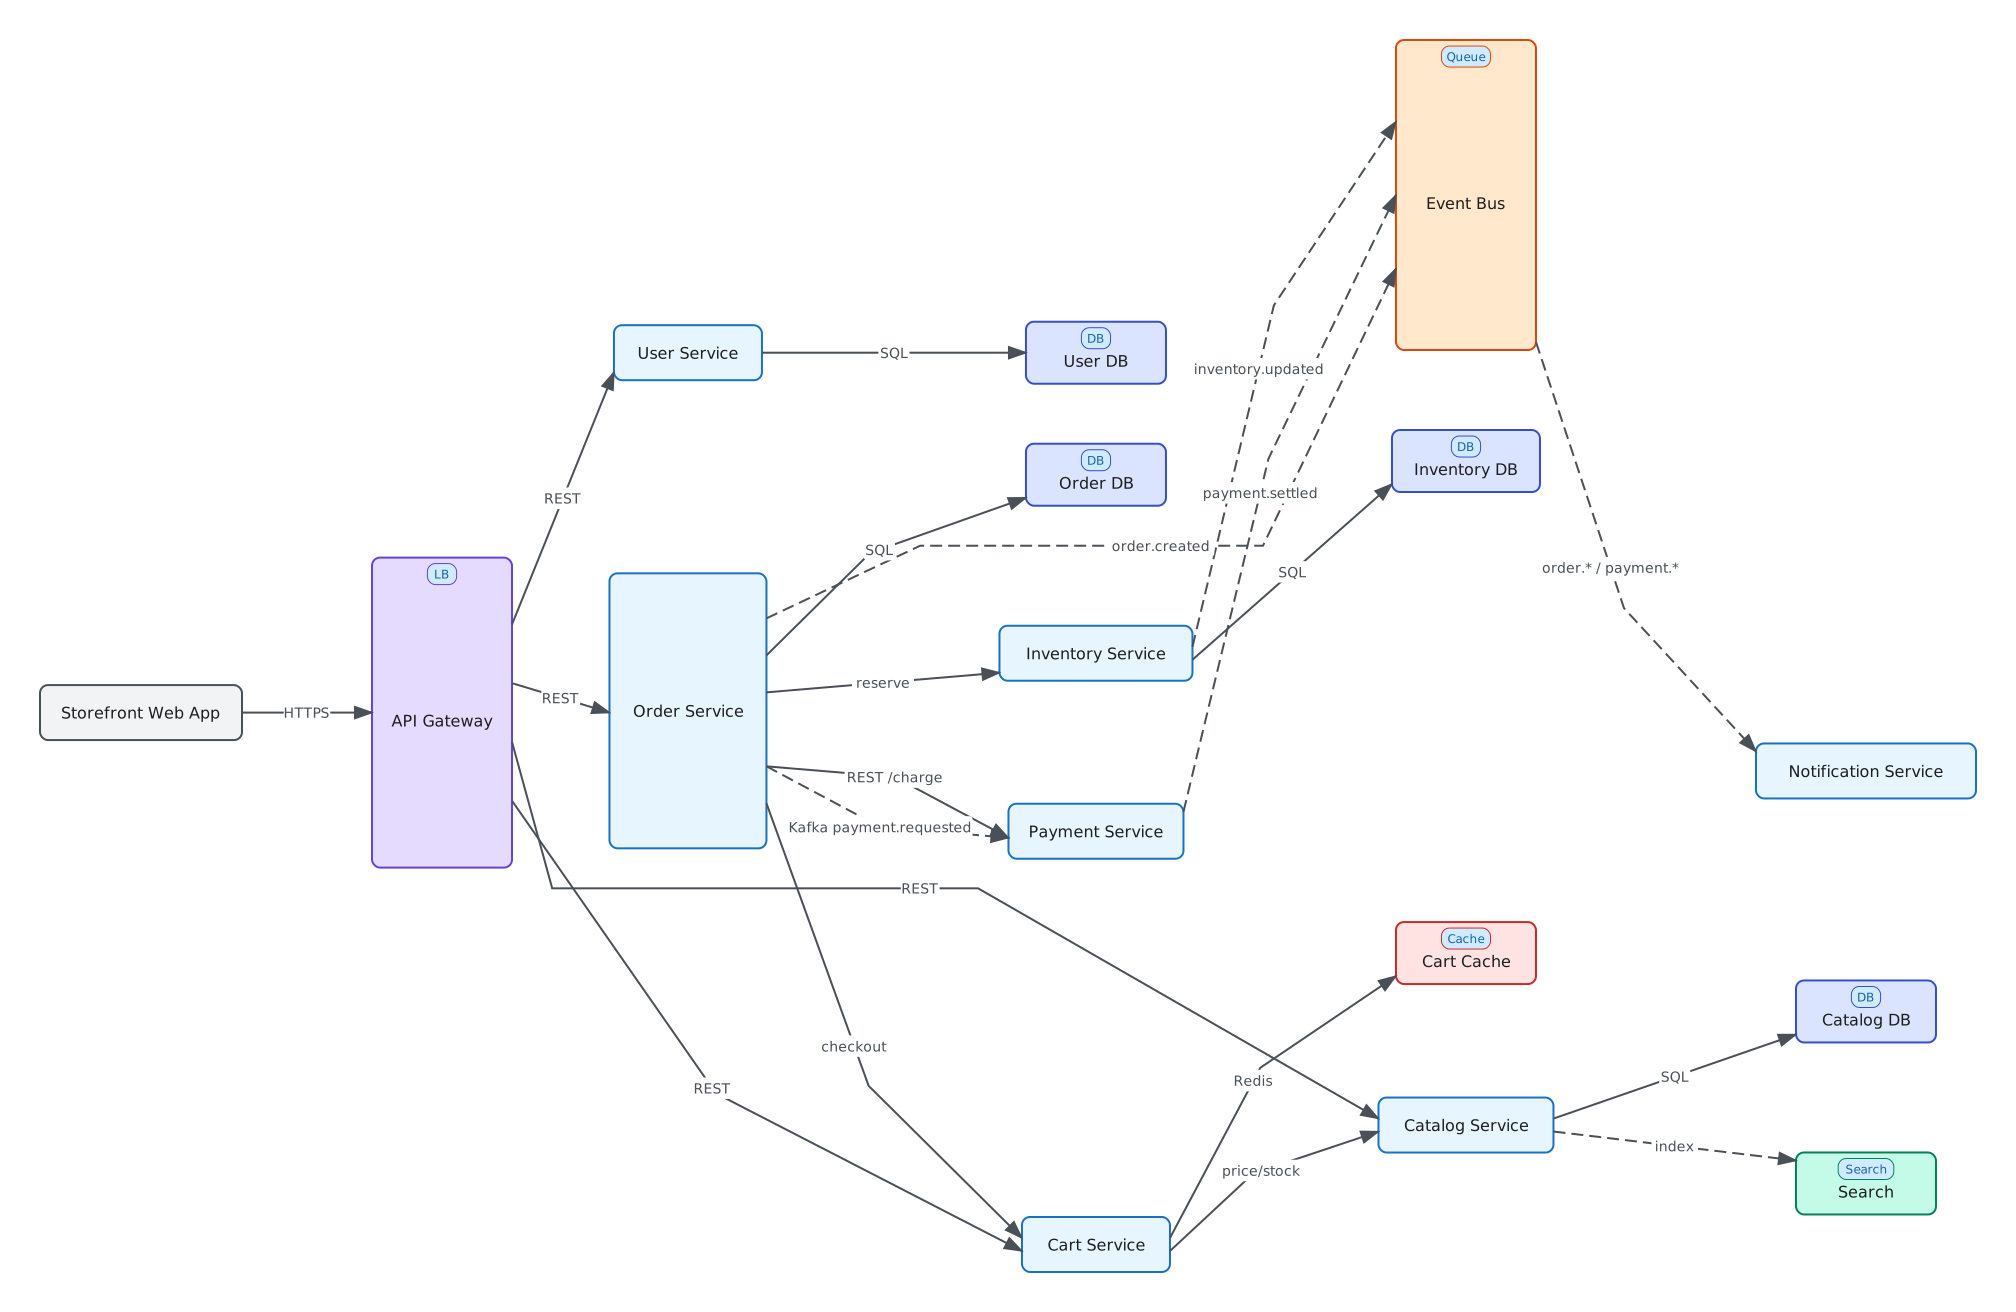
The diagram above was rendered from a knowledge graph — a single
.claude/architecture.mdfile. NoticeOrder Service → Payment Serviceappears twice: a solidREST /chargecall and a dashedKafka payment.requestedevent. Two communication modes, two arrows.
Why a knowledge graph?
A one-off diagram goes stale the moment you close it. A knowledge graph is a living model:
- One source of truth, many views — store the whole system once, then render the full picture, a single domain, or everything within N hops of one service.
- Consistent across diagrams — the same service keeps the same id, styling, and metadata everywhere.
- Queryable — ask "what breaks if payments goes down?" and get the real blast radius, not a guess.
- Self-checking — lint for dependency cycles, single points of failure, and orphaned services.
- Lives in git — review architecture changes in PRs; the markdown diffs cleanly.
The file is human- and machine-readable
The graph is a single markdown file (default .claude/architecture.md):
Edit it by hand or let the AI maintain it — it round-trips losslessly either way.
Just ask your AI
"Map this codebase into the architecture knowledge graph"
"Link the order service to payments over Kafka"
"What depends on the payment service? Render just its neighborhood"
"Render the orders domain as a focused diagram"
"Lint the architecture for cycles and single points of failure"
"Import my existing diagram.excalidraw into the knowledge graph"
"Generate an onboarding guide from the architecture"
See the Knowledge Graph tools for the full tool list.
Contributing
See CONTRIBUTING.md for details.
License
MIT - see LICENSE.