Agentburn README
The full upstream README, mirrored here for reference. Install config, tool schemas, adoption signals, and an original overview live on the Agentburn listing page.







Claude Code · Codex CLI · Gemini CLI · opencode · OpenClaw · Hermes Agent — one normalized core, local, read-only, zero dependencies
You didn't run out on your average day
You ran out inside one window. On this machine that window was 5.4× the median one — same person, same week, same subscription.
Your assistant's own logs already know which window it was and what filled it. Nothing else on your machine does: the built-in counter shows a total, your invoice shows a total, and neither says which five hours took you out.
One command, no account, nothing leaves your computer:
Two ways agents cost you, two questions
| If you pay… | what actually runs out | ask |
|---|---|---|
| a subscription (Claude Code Pro/Max) | the rolling usage window — the invoice is fixed, the wall is not | agentburn limits |
| per token (API keys, OpenClaw, Hermes) | money, mostly while you're asleep | agentburn |
Both read the same local logs. Neither invents a number the data doesn't contain.

agentburn limits — the subscription view
Optimizing a subscription doesn't change your bill. It changes how far you get before you're cut off. That is a window problem, and windows need intra-session resolution — a single session routinely spans several of them.
-
Peak vs typical. Your worst rolling 5-hour window against the median of your own active ones. The ratio is the finding: a wall is hit by the peak.
-
What filled it — by model, by source (you / subagents / scheduled work), and by kind (cache reads vs cache writes vs output).
-
Measured against your own wall — automatically. Anthropic doesn't publish the formula behind those allowances, so agentburn refuses to invent a threshold. But Claude Code writes the cut-off into the transcript itself ("You've hit your session limit · resets 8:30pm"), and every one of those moments is a measured ceiling. With several, the ceiling is their median:
No cut-off in your logs yet?
--hit "2026-08-20 14:30"names one by hand. A measured ceiling is remembered in~/.agentburn/ceiling.json, so the status line below knows it too. -
Codex: the provider's own reading. Codex CLI writes
rate_limits.used_percentnext to every request. agentburn pairs each reading with your weighted usage of the same window and takes the median — a ceiling from the provider's arithmetic, not from a cut-off. Treat it as an estimate: that percentage counts every device and app on the account, while your local rollouts are only part of it — and when Codex stops reporting a window (plan or client change), a later peak is flagged as measured on earlier windows, not sold as an overrun. -
Time to wall. Ceiling minus the current window, divided by the pace of the last half hour. The number you actually want while working.
-
The week, too. The heaviest rolling 7-day span, how much of it this week already is, and a weekly ceiling when Claude Code recorded a weekly cut-off.
-
By project. Sessions record their working directory; the peak window is split by it.
agentburn statusline — the wall, live, inside Claude Code
One line, no colour, built for Claude Code's statusLine:
Reads only the last three days of logs (the ceiling comes from the state file), so it stays cheap enough to run on every turn.
agentburn context — what a long context costs
Every call re-reads its whole context, and on a subscription that re-reading is the window: a turn at 300k costs what three turns at 100k cost. Claude Code records the exact context size of every call, so this is measured, not modelled:
- The
/cleararithmetic — the part of every call's context above a threshold, at the cache-read rate: the honest saving of a restart habit, assuming the same work in shorter sessions. - Skill costs, measured — the context growth right after a lone
Skillcall, median of recent loads. Bundled skills never touch the disk; the transcript sees all of them. - By effort level — how much of the window each
effortsetting took. - Findings with a lever land in
agentburn fix: the restart threshold, and the heavy skills.
agentburn commits — what a commit cost you
Sessions record their working directory and branch; your repositories record when each commit landed. The usage between two consecutive commits is what the second one cost — read-only git log, nothing written:
Weighted tokens = tokens × published price ratios (cache read 0.1×, cache write 1.25×, output per model), normalized to one input token of the reference model. Every ratio is public; none of them is a guess about how the provider counts.
agentburn — the money view
- Where it burns — by source:
cron/subagent/gateway:telegram|discord|whatsapp/cli. Always-on ≠ free. - 🌙 While you slept — the overnight bill, isolated and named (
--night 23-7). - Fixed overhead — uncached input tokens per API call, per source, calibrated against a public benchmark.
- Subagent rollups — delegation cost chained back to the session that spawned it.
agentburn why— behavioral forensics: re-read loops, retry storms, idle heartbeats, per-cron receipts, context thrash.agentburn fix— ready-to-paste config patches, dry-run by design.
agentburn fix — findings become config, not advice
Not "consider a cheaper model" but the exact file and the exact lines. Patch generators exist only for levers verified against the agent's own source or documented configuration:
| Agent | Verified levers |
|---|---|
| Claude Code | registered MCP servers (~/.claude.json, .mcp.json), always-loaded CLAUDE.md memory files, the session-restart threshold (measured), heavy skills (measured per load) |
| Hermes | per-job model / enabled_toolsets (cron/jobs.py), per-platform toolsets (gateway/run.py) |
| OpenClaw | heartbeat.{every, activeHours, model, lightContext} (config/types.agent-defaults.ts) |
There is no --apply on purpose: it's your agent's config. Paste it yourself, then prove the saving with --save-baseline → --compare.
Why trust these numbers
Token trackers quietly disagree with each other (2–91× in public issue threads). agentburn takes the opposite stance:
- Numbers come from the agent's own accounting, read-only. No scraping, no proxies, no guessing.
- One reply is counted once. Claude Code writes one transcript line per content block, each carrying the same
usage; summing lines inflates calls and tokens ~1.8×. agentburn deduplicates byrequestId(found and fixed in 0.14.0 — earlier absolute totals from this tool were inflated by that factor; ratios were not). - Provider-billed costs are shown as-is; estimates are marked
~; mixed data is labeled mixed. - Where a price doesn't exist, none is invented. Claude Code records no costs and subscription usage has no honest per-token price — so that adapter reports tokens and windows, never dollars.
- Sessions with messages but zero recorded tokens (known accounting gaps, e.g. hermes-agent #12023) are detected: totals become an explicit lower bound, and fixing the accounting becomes recommendation #1.
- Result weights on agents that don't record them are labeled estimates, and only ever used to rank findings against each other.
Speed
Transcripts are append-only, so they are parsed once. Each file's parse is cached under its size and mtime in ~/.agentburn/cache, and a run reuses every file that hasn't changed:
| 30 days over 3.1 GB of Claude Code logs | |
|---|---|
| first run (parses everything, writes the cache) | ~190 s |
| every run after that | ~3 s |
| cache size | 29 MB (0.9% of the logs) |
A file that grew is re-parsed and re-cached; nothing else is touched. --no-cache (or AGENTBURN_NO_CACHE=1) forces a full re-parse, --clear-cache deletes it. The cache is derived data — deleting it costs time, nothing else.
Privacy
Everything runs locally and reads your logs read-only. No network calls, no telemetry, no accounts. The report is yours. The only commands that touch the network say so: drift GETs a public trends file, --submit opens a prefilled issue you review and send.
The parse cache in ~/.agentburn/cache (mode 0700) holds the same tool names and truncated argument keys the reports show, derived from logs already on this machine — never message content. --clear-cache removes it.
Why this exists
Always-on agents bill you around the clock — and their built-in counters only show totals:
"73% of every API call is fixed overhead — ~13.9K tokens of tool definitions and system prompt, resent every time." — hermes-agent #4379
"One entrant wrote about waking up to a $47 surprise bill from an overnight run — that's not an exotic failure, it's the default behavior of an unsupervised loop." — dev.to
How it compares
| agentburn | ccusage | codeburn | built-in /usage | |
|---|---|---|---|---|
| Usage windows (peak vs typical, what filled them) | ✅ | — | — | current window only |
| Ceiling measured from your own recorded cut-offs · time to wall · status line | ✅ | — | — | current window % |
The price of long contexts · what a /clear would have saved · skill cost per load | ✅ | — | — | — |
| Cost per git commit | ✅ | — | — | — |
| Burn by source (cron · heartbeat · gateways · subagents) | ✅ | — | — | % only, 7 days |
| 🌙 the overnight bill, isolated | ✅ | — | — | — |
Behavioral forensics (why: loops, retry storms, failed-run cost) | ✅ | — | — | — |
Ready config patches (fix, verified levers) | ✅ | — | — | — |
| MCP server (the agent answers for its own bill) | ✅ | — | — | — |
| Totals / live blocks / many CLIs | basic | ✅ best-in-class | ✅ TUI, 25 providers | totals |
ccusage and codeburn are excellent at what they do — agentburn deliberately starts where they stop (ccusage scoped per-tool analysis out).
Supported agents
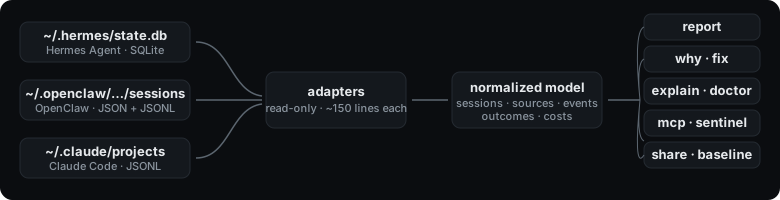
One normalized model, one adapter per agent. Run agentburn and every agent found on the machine gets its own report.
| Agent | Status | Data source | Notes |
|---|---|---|---|
| Claude Code | ✅ | ~/.claude/projects/**.jsonl | tokens and windows, by design: no local costs, no honest per-token price for a subscription |
| OpenClaw | ✅ | ~/.openclaw/agents/*/sessions/sessions.json | heartbeat is its own category — the famous one |
| Hermes Agent | ✅ | ~/.hermes/state.db (+ optional request dumps) | costs from the agent's own accounting |
| Codex CLI | ✅ | ~/.codex/sessions/**/rollout-*.jsonl | tokens and windows; the only agent that records the provider's own usage % with every request |
| Gemini CLI | ✅ | ~/.gemini/tmp/*/chats/session-*.json | per-turn tokens incl. thoughts; working directory via projects.json |
| opencode | ✅ | ~/.local/share/opencode/opencode.db | costs from the agent's own price list; free/self-hosted providers show tokens only |
Adapters are ~150 lines over a shared model — PRs for the next one welcome.
Everything else
🔌 agentburn mcp — your agent answers for its own bill
A zero-dependency MCP stdio server exposing burn_report / burn_limits / burn_context / burn_commits / burn_why / burn_card. Register it and ask "where do you burn my money?" — it profiles its own database and explains.
Prefer skills? There's a ready SKILL.md for ~/.claude/skills/agentburn/ (or the Hermes/OpenClaw equivalents).
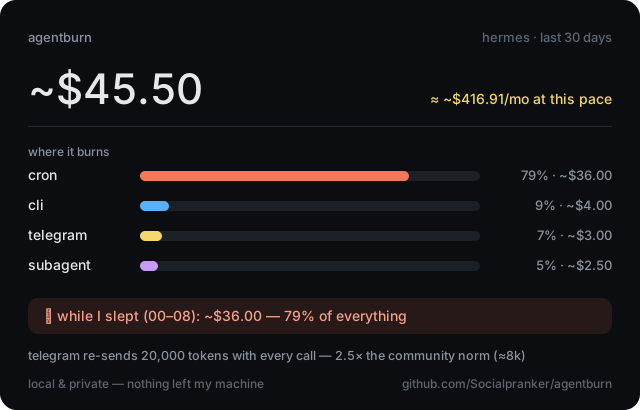
📤 --share — an anonymized card, safe to post
Categories, models and totals only; session titles, paths and content are excluded by construction. --svg card.svg renders the same card as an image.
📐 --save-baseline / --compare — prove the saving
Snapshot your pace, change the config, then agentburn --compare shows the delta — pace-normalized, so a 7-day baseline compares honestly with a 30-day window. Every recommendation becomes a testable promise.
🧭 agentburn drift — your spend × the world's direction
Are you paying for a model the world is leaving? Your side is computed locally; the world side is one read-only GET of token-history's public trend JSON (archived daily from OpenRouter's rankings). Nothing about you is sent anywhere; --trends FILE works fully offline.
🧠 agentburn explain — LLM interpretation, local-first
The default endpoint is localhost; a remote one requires --yes-remote and receives a redacted summary (titles → session-N, paths → basenames, content never present to begin with).
🩺 agentburn doctor + 🚨 sentinel mode
doctor names the broken combinations (provider × model × source) behind zero-usage and unpriced sessions, and generates a ready-to-paste upstream bug report — counters only.
Sentinel mode is a budget guard for server agents:
📊 agentburn rank — the Burn Index (community percentiles)
Anonymous percentiles of efficiency — the benchmark volume-leaderboards can't be: nothing here rewards burning more. Joining is consent-by-click: agentburn --submit prints the exact anonymized payload (ratios and a coarse spend band — never raw volumes, titles or paths), then a prefilled GitHub-issue link that you open and submit. Percentiles need 5+ setups per metric before they mean anything.
Related
token-history — the macro view: daily archive of which agents the world uses. agentburn is the micro view: where yours burns.
License
MIT
mcp-name: io.github.Socialpranker/agentburn
the token-* family · token-history — which agents the world runs · agentburn — where yours burns
if this saved you a window's worth of work, a ⭐ helps the next person find it