AI agent observability with deterministic record/replay for debugging agent failures.
Copy the AI prompt to install this server into Claude Code, Cursor, or another agent β or use 1-click editor setup below.
π‘ Paste into ~/Library/Application Support/Claude/claude_desktop_config.json (macOS) or %APPDATA%\Claude\claude_desktop_config.json (Windows)
Record your agent's LLM calls once, replay them offline in under 1 ms, zero API calls, zero cost.
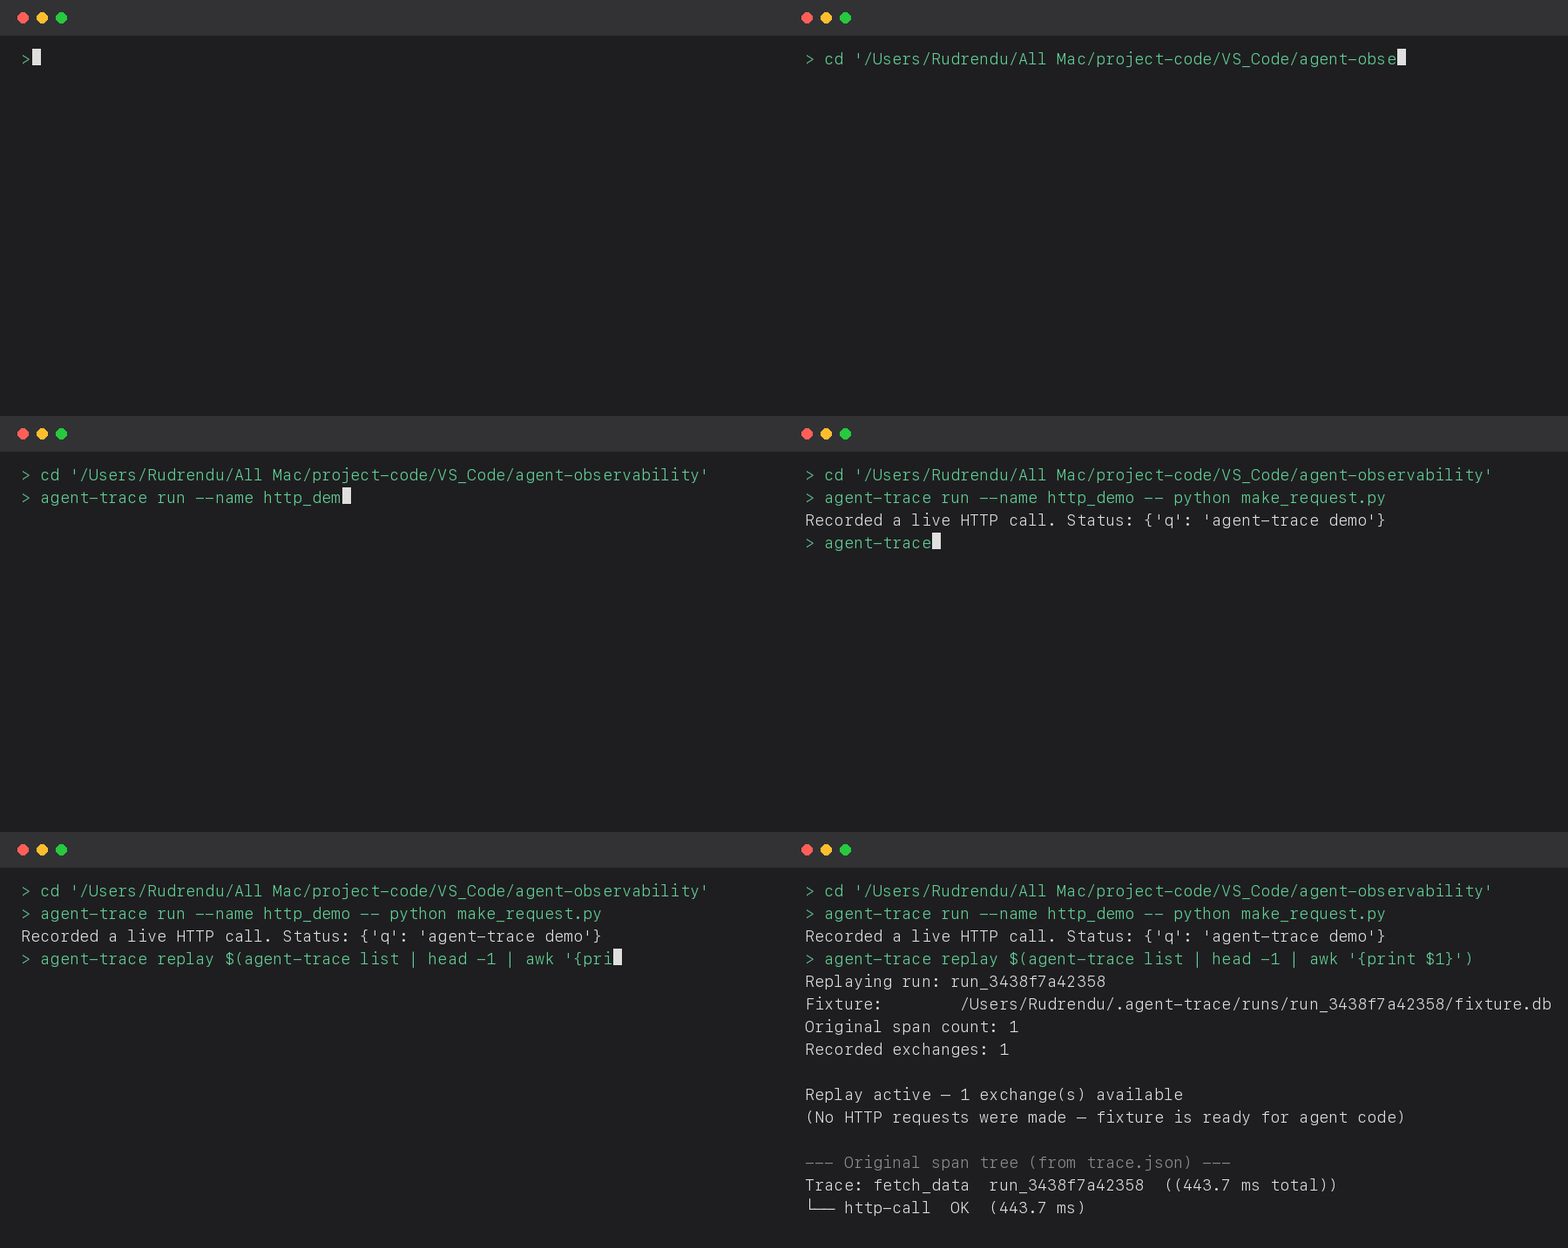
Your LangGraph agent fails after step 8. LangSmith shows you what broke. To reproduce it: 8 more LLM calls. 30 more seconds. $0.15 more in API cost. If the failure was caused by a transient model output, you can't reproduce it at all.
Agent Observability fixes this. Record once. Replay offline in 0.93 ms. Zero API calls. Zero cost.
LangGraph support:
OpenAI Agents SDK support:

list, inspect, diff, replay, and run all support --json for machine-parseable output β an orchestrating agent or CI job can call any of them the same way a person would and parse the result. (run --json prints its own status to stderr and the child process's output to stdout, ending with one final JSON summary line, since the child's own output can't be made structured.) show has no --json mode of its own β it accepts --errors-only to filter its output to failed spans instead. See the full CLI reference below for every subcommand's flags.
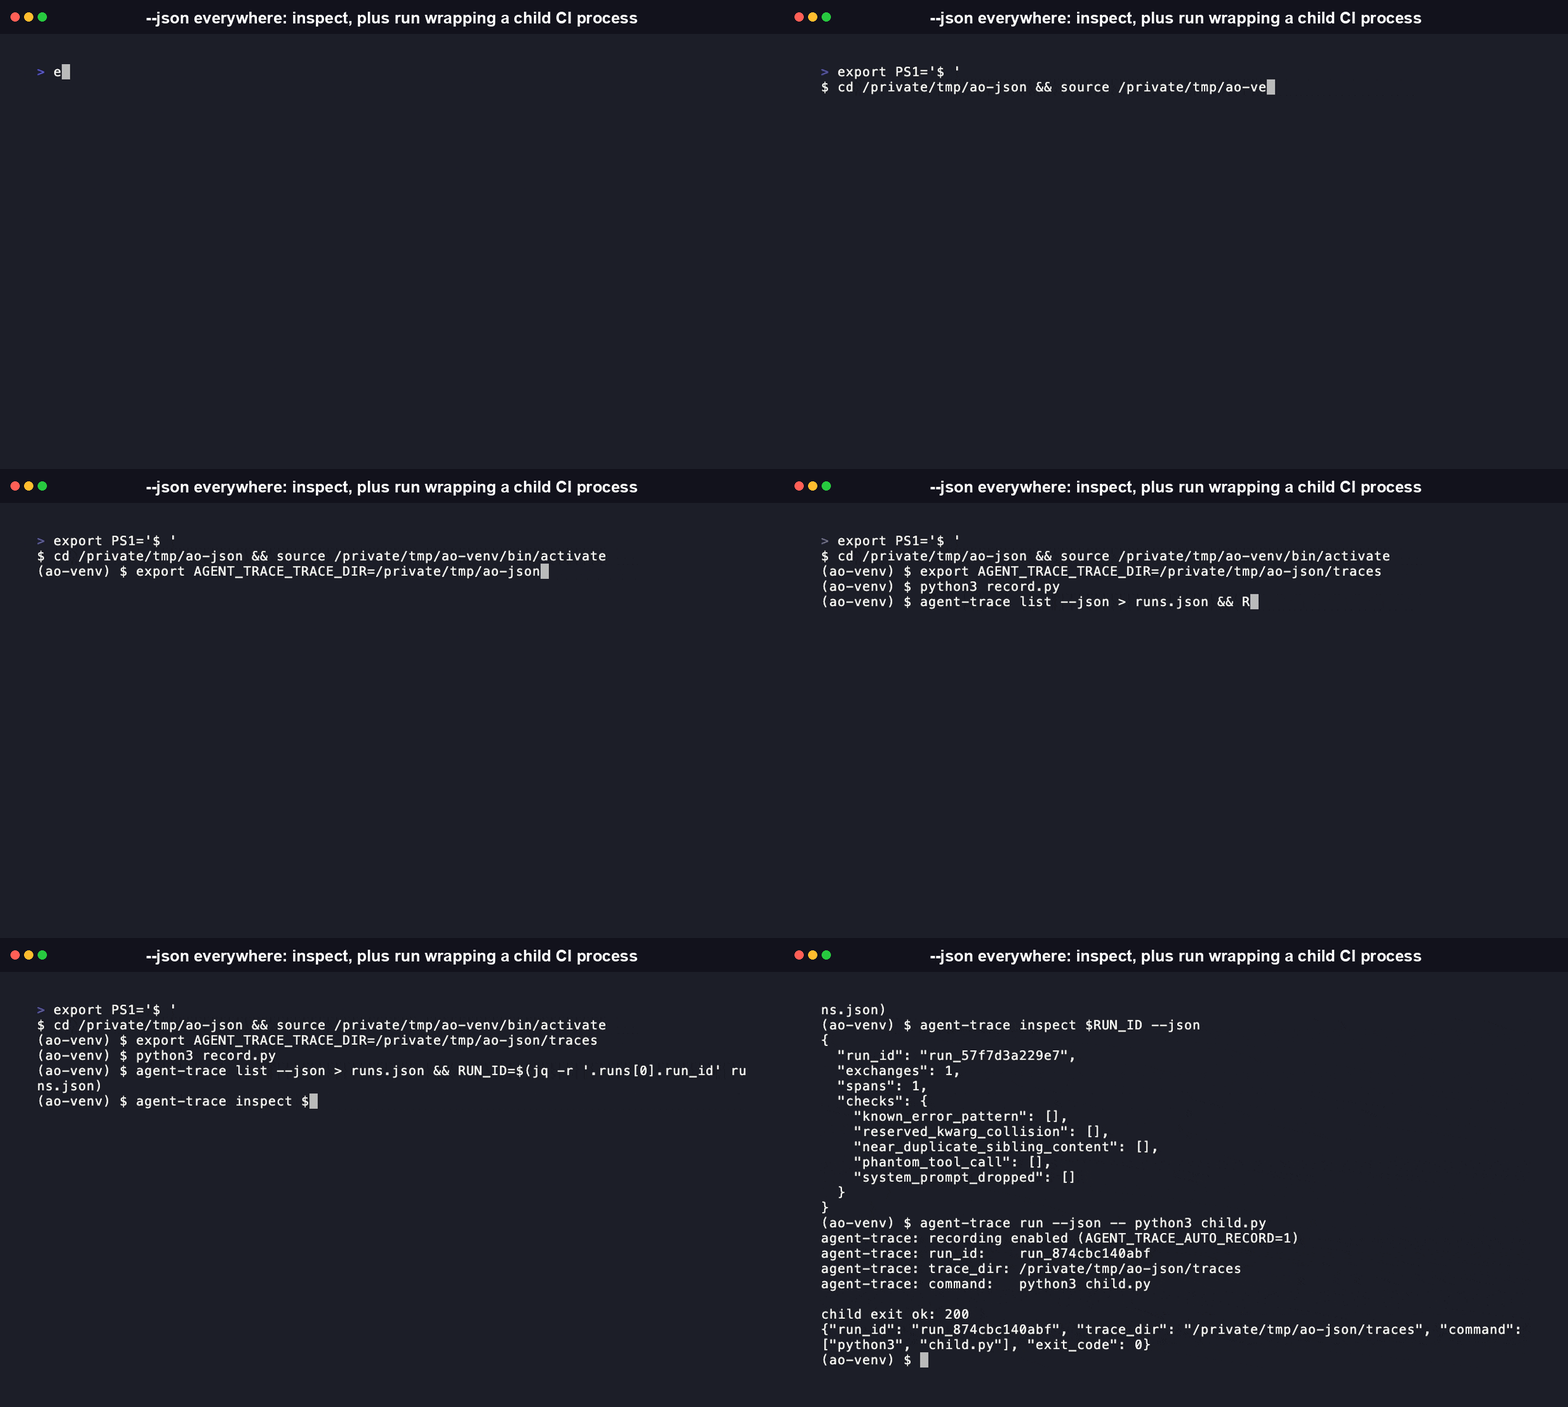
Want programmatic control instead of the CLI? Use the Python API:
Replay offline β no API calls, no tokens:
[!TIP] To store the input for later retrieval in replay, call
ctx.fixture.set_metadata('input', query)inside the recording context.
[!NOTE] Sync and async clients: Agent Observability intercepts
httpx.Client,httpx.AsyncClient, andrequests.Sessionβ including the async client used by default in the OpenAI Python SDK v1.x and Anthropic SDK. The patch is installed at request-dispatch time, so it also covers clients constructed before recording/replay starts (e.g. a module-levelopenai.AsyncOpenAI()instance).

agent-observability ships a Model Context Protocol server so an AI agent (Claude, Cursor, or any MCP-compatible client) can list, inspect, and replay recorded runs directly, without a human invoking the CLI by hand.
Install the extra:
Add it to your MCP client's config (for Claude Desktop, claude_desktop_config.json):
The server exposes one tool, run, that shells out to the agent-trace CLI with the given
subcommand and arguments plus --json, and returns the parsed JSON result:
Transport is stdio, so there is nothing to host: the MCP client spawns the server as a local
subprocess. Source: src/agent_trace/mcp_server.py.
LangGraph Β· OpenAI Agents SDK Β· CrewAI Β· AutoGen Β· LlamaIndex Β· Haystack Β· Agno Β· PydanticAI Β· Google GenAI
Plus: any httpx.Client, httpx.AsyncClient, or requests.Session β no framework required.
agent-trace has 7 subcommands. Every subcommand accepts -h/--help for the
same detail shown here.
agent-trace versionPrint the installed version and exit. No arguments.
agent-trace listList all recorded runs in the trace directory (~/.agent-trace/runs by
default, or $AGENT_TRACE_TRACE_DIR).
| Flag | Default | Description |
|---|---|---|
--json | off | Print machine-readable JSON instead of a human-readable table. |
agent-trace show <run_id>Pretty-print the stored trace.json for a run.
| Argument | Required | Description |
|---|---|---|
run_id | yes | Run ID, e.g. run_abc123def456. |
| Flag | Default | Description |
|---|---|---|
--errors-only | off | Only print ERROR-status spans, each with its captured exception text. |
show has no --json mode β it prints the trace (colorized via rich when
installed, plain json.dumps otherwise), not a structured summary object.
agent-trace replay <run_id>Enter replay mode for a run and print the resulting span tree, plus streaming
timing, HTTP error exchanges, and the same cross-span diagnostics show
prints (error classification, duplicate node spans, retry storms,
misattributed spans, checkpoint durability, zero-task updates).
| Argument | Required | Description |
|---|---|---|
run_id | yes | Run ID, e.g. run_abc123def456. |
--json | no | Print a structured JSON summary (fixture path, span/exchange counts, the original trace) instead of the human-readable span tree. |
No flags.
agent-trace inspect <run_id>Auto-flag known malformed request/response shapes and cross-span anomalies for a run.
| Argument | Required | Description |
|---|---|---|
run_id | yes | Run ID, e.g. run_abc123def456. |
| Flag | Default | Description |
|---|---|---|
--registered-tools | none | Comma-separated list of registered tool names. Enables the tool-call name fuzzy-match, dotted-compound, ReAct action-name-not-registered, and tool-call-name-not-registered checks. |
--configured-host | none | The framework's configured LLM endpoint host. Enables the endpoint-host-mismatch check. |
--check-kwarg | none | Dotted kwarg path (e.g. extra_body.chat_template_kwargs.thinking) expected to be present on the wire. Flags requests where it's absent. |
--diff-field | none | Response field to check for wire-present-but-downstream-absent β a top-level key (e.g. usage) or a dotted/nested path with numeric list-index segments (e.g. choices.0.message.reasoning_content, for provider fields like DeepSeek's reasoning_content). |
--diff-get-post-field | none | Dotted field path (e.g. instructions) to compare between an earlier GET response and a later, causally-related POST request body referencing the same resource id (see issue #2620). Flags stale-value mismatches, such as a GPTAssistantAgent POST /runs still sending instructions that no longer match what GET /assistants/{id} returns. |
--diff-get-post-id-field | id | Field name the GET response uses for the resource id. |
--diff-get-post-post-id-field | same as --diff-get-post-id-field | Field name the POST request body uses to reference the same resource id, if different (e.g. assistant_id). |
--json | off | Print machine-readable JSON instead of human-readable flag lists. |

agent-trace diff <run_id_a> <run_id_b>Diff two recorded runs' exchanges, matched by URL, highlighting field-level
differences between request/response bodies, plus a restart-vs-resume check
for a shared LangGraph thread_id (see issue #161).
| Argument | Required | Description |
|---|---|---|
run_id_a | yes | First run ID. |
run_id_b | yes | Second run ID. |
| Flag | Default | Description |
|---|---|---|
--json | off | Print machine-readable JSON instead of a human-readable diff. |
agent-trace run -- <command> [args...]Exec a child process with recording pre-enabled process-wide
(AGENT_TRACE_AUTO_RECORD=1), so the first import agent_trace inside that
process β even one owned by a third-party CLI like langgraph dev β starts
recording with zero code changes required in your own agent code. Exits with
the child process's own exit code.
| Flag | Default | Description |
|---|---|---|
--run-id | random (run_<12-hex-chars>), printed on start | Explicit run ID. |
--name | auto-record | Trace name recorded in trace.json metadata. |
--json | off | Print agent-trace's own status as one final JSON line on stdout (status lines go to stderr instead). Must come before the child command, e.g. agent-trace run --json -- langgraph dev. |
child_command (positional) | β | Everything after -- is exec'd as the child process, e.g. -- langgraph dev. This captures the remainder of the command line, so --run-id/--name/--json must be given before it, not after. |
A LangGraph run fails after step 8. Your trace in LangSmith or Langfuse shows what broke. But to reproduce it you have to re-run the entire agent: 8 more LLM calls, 30 more seconds, another $0.15 in API cost. If the failure was caused by a specific tool response or a transient model output, you can't reproduce it at all. You're debugging against a moving target.
Agent Observability solves this at the HTTP transport layer. It records every request and response verbatim to a local SQLite file. Replay serves those exact bytes back in sequence, in under 1 ms per exchange: same code path, same span tree, same failure. No API calls.
Record once. Commit the fixture. Replay in every CI run at zero API cost:
Set AGENT_TRACE_NETWORK_GUARD=1 in CI. Any HTTP call not in the fixture raises NetworkGuardError immediately β catching regressions before they hit production.
Short answer: they show you what happened. They can't reproduce it offline. LangSmith's VCR cassettes are Python + LangChain only, don't capture full wire bytes, and require a LangSmith account. Agent Observability works on any Python HTTP client, needs no account, and replays in 0.93 ms with 100% fidelity.
Most observability tools for LLM agents are observe-only β they show you a trace of what happened, but reproducing a failure still requires re-running the full agent against live APIs.
| Capability | Agent Observability | LangSmith | Langfuse | Helicone | OpenLLMetry |
|---|---|---|---|---|---|
| Offline replay from local fixture | Yes | Partial ΒΉ | No | No | No |
| Works with any HTTP client | Yes | No | No | No | No |
| CI replay without API keys | Yes | Partial ΒΉ | No | No | No |
| Deterministic span timing in replay | Yes | No | No | No | No |
| Captures raw HTTP request/response bytes | Yes | No | No | Yes | No |
| Span-level tracing | Yes | Yes | Yes | Yes | Yes |
| OTLP export (Jaeger, Grafana Tempo) | Yes | No | Yes | No | Yes |
| Open-source core | Yes | No | Yes | No | Yes |
| Local-only, no server required | Yes | No | Self-host | No | Self-host |
ΒΉ LangSmith has LANGSMITH_TEST_CACHE / VCR cassettes (langsmith[vcr]) for Python + LangChain only. It captures HTTP to api.openai.com but not arbitrary HTTP clients, does not record full wire-level bytes, and requires a LangSmith account.
Choose LangSmith if your team is on LangChain and needs dataset management, prompt versioning, and human feedback loops.
Choose Langfuse if you want a fully open-source, self-hostable observability stack with strong Postgres-backed storage.
Choose OpenLLMetry if your team already runs on OpenTelemetry and wants standard gen_ai.* spans without adding a new observability system.
Agent Observability is not a replacement for dashboards and eval pipelines. It solves the specific upstream problem: reproducing a specific failed run without any LLM API cost, for any agent built on any Python HTTP client.
Agent Observability emits OTLP spans. Run a local observability stack to browse trace trees:
Starts three services (all optional):
http://localhost:16686) β OTLP span ingestion and trace UIhttp://localhost:3000) β dashboards and alertsThen point your exporter at the collector:
LangGraphTracer.on_llm_error even though it never reaches the interceptor (see Known Limitations)Agent Observability's capture model is HTTP-interceptor-based (plus
instrumented framework callbacks for the integrations under
src/agent_trace/integrations/) and process-local. That model has real
edges β stated explicitly here so they're clear before you hit one, not
after:
Process-local only. Recording/replay happens inside the Python
process you import agent_trace into (httpx.Client(transport= RecordingTransport(...)), session.mount(..., RecordingAdapter(...)),
or ReplayEngine.replay()'s monkeypatches β see
src/agent_trace/interceptor/). It cannot observe or replay calls made
by a third-party hosted service you don't run or deploy yourself
(e.g. a vendor's own hosted chat assistant) β only your own process's
outbound calls.
gRPC coverage is partial. src/agent_trace/interceptor/grpc_hook.py
patches grpc.secure_channel/grpc.insecure_channel (and the grpc.aio
equivalents) to capture Gemini/Vertex AI traffic that bypasses httpx
entirely β unary-unary calls (e.g. GenerateContent) and sync
unary-stream calls (e.g. StreamGenerateContent) are fully recorded and
replayed. Client-streaming and bidirectional-streaming gRPC calls, and
any grpc.aio streaming call, are not captured β those go straight
to the live network unintercepted, both during recording and (if
attempted) replay.
Capture starts once a request object exists. RecordingTransport. handle_request/AsyncRecordingTransport.handle_async_request
(httpx_hook.py) and RecordingAdapter.send
(requests_patch.py) only run once a fully-constructed
httpx.Request/PreparedRequest reaches them. Any exception raised
before that β while an SDK is serializing a tool schema, building
headers, or otherwise assembling the call, or even earlier, during plain
Python object construction (e.g. TypeError from abc.ABCMeta when
instantiating an abstract class incorrectly) β happens entirely upstream
of the interceptor's capture surface and produces zero fixture rows.
A wired-in framework integration's own error callback (e.g.
LangGraphTracer.on_llm_error) does still capture such pre-HTTP
exceptions when they propagate through that framework's own
try/except β so "invisible to the interceptor" is not the same as
"invisible everywhere": it depends on whether a framework integration is
wired in for the exception to pass through.
No visibility into a framework's own print/display code. Exceptions
raised inside local logging/printing/display machinery β e.g. rich
Console output, IPython/Jupyter display hooks, triggered by a framework's
own verbose=True logging β have zero HTTP traffic and zero framework
callback surface. No existing or planned capture mechanism (HTTP
interceptor, MCP stdio-transport hook, or any framework integration)
observes this category of failure.
release.yml). SLSA Level 2 provenance via Sigstore OIDC signing is verified working (.sigstore.json bundles genuinely produced for every dist artifact); SBOM (CycloneDX JSON + XML) is generated and attached to the GitHub Release alongside the signed artifacts.dependabot.yml opens weekly pip and monthly GitHub Actions version-bump PRs. Dependabot security-advisory alerts, secret scanning, and secret scanning push protection are all enabled on this repo.~/.agent-trace/runs/ contain full HTTP request and response bodies, including API keys and prompt contents. Add .agent-trace/ and *.db to your .gitignore.agent.obs.oss.security@gmail.com with a 48-hour response SLA.[!WARNING] Never commit a fixture generated against a production API key. Fixture files capture full request/response bodies verbatim, so a committed fixture can leak real API keys and prompt contents into your git history.
chromadb (optional [crewai] extra only): GHSA for a pre-authentication code injection vulnerability affecting chromadb 1.0.0 through the current latest release (1.5.9). The upstream fix (chroma-core/chroma PR #7237) merged 2026-07-07 but has not shipped in any PyPI release since β there is currently no patched version to pin to. chromadb is pulled in only by the optional crewai integration extra (pip install agent-observability-trace-cli[crewai]), not installed by default, and this project never runs a Chroma server with an exposed HTTP API, so the actual exploit path (an attacker-reachable /api/v2/.../collections endpoint) does not apply to normal usage of this package. If you install the [crewai] extra and run your own Chroma server elsewhere, track the upstream advisory and update chromadb as soon as a fixed release ships.
Future roadmap: once chromadb ships a release containing the fix, pin chromadb to that version immediately. If no fix has shipped by the next scheduled security review and the [crewai] extra sees negligible real-world usage, removing the extra entirely is the fallback under consideration to close this out for good.
What is Agent Observability, and how is it different from a typical LLM tracing tool?
It's a Python library and CLI (agent-trace) that records every HTTP request and response your agent makes, verbatim, to a local SQLite fixture, then replays those exact bytes later with no network call. Most tracing tools, including LangSmith, Langfuse, Helicone, and OpenLLMetry, show you what happened during a run. Agent Observability additionally lets you reproduce that exact run offline, deterministically, without touching the live API. See "Why not just use LangSmith, Langfuse, or Helicone?" above for the full capability breakdown against those four tools.
How does deterministic record/replay actually work?
Recording patches httpx.Client, httpx.AsyncClient, and requests.Session at the transport layer (src/agent_trace/interceptor/) to capture every outbound request and response as raw bytes into fixture.db. Replay installs a FixtureClock (src/agent_trace/core/clock.py) and serves those same bytes back in the original sequence, so the code path, span tree, and timestamps all match the original recording. The benchmark numbers quoted above (0.011% recording overhead, 0.93ms mean replay latency, 100% fidelity) come from benchmarks/test_overhead.py, benchmarks/test_replay_vs_live.py, and benchmarks/test_fidelity.py in this repo, runnable yourself with uv run pytest benchmarks/.
How do I install it, and what platforms does it support?
pip install agent-observability-trace-cli, or uv add agent-observability-trace-cli. It requires Python 3.10 or newer and depends only on httpx and rich, no compiled extensions, so it installs anywhere those wheels do. CI (.github/workflows/ci.yml) passes on Ubuntu, macOS, and Windows, across Python 3.10 through 3.13. An npm wrapper, agent-observability-trace-cli (source under npm/ in this repo), is also published for teams that reach for npx/npm, but it still shells out to the Python CLI under the hood, so the Python package must be installed too.
How does this compare to LangSmith specifically?
LangSmith's LANGSMITH_TEST_CACHE (VCR-style cassettes, via langsmith[vcr]) is the closest built-in equivalent. It's Python plus LangChain only, captures HTTP calls to api.openai.com rather than any HTTP client, doesn't record full wire-level bytes, and requires a LangSmith account. Agent Observability works with any Python HTTP client, plus dedicated interceptors for gRPC, aiohttp, botocore, and WebSocket traffic, records full request and response bytes locally, and needs no account or hosted service. Pick LangSmith if you're already on LangChain and want dataset management, prompt versioning, and human feedback loops alongside tracing. Pick Agent Observability if the goal is reproducing one specific failed run at zero API cost, regardless of which SDK made the call.
What happens if replay can't find a matching fixture entry?
With AGENT_TRACE_NETWORK_GUARD=1 set, any request missing from the fixture raises NetworkGuardError immediately instead of silently falling through to a live call. The most common cause is an HTTP client constructed before the recording or replay context was entered, since the patch only applies to clients created inside the start_trace/replay block. See "Known limitations" above for the full list of edges, including partial gRPC streaming coverage and pre-HTTP exceptions that never reach the interceptor.
Does it capture agents built on non-Python frameworks?
No. Capture is a Python HTTP-transport interceptor plus instrumented callbacks for the integrations under src/agent_trace/integrations/ (LangGraph, CrewAI, AutoGen, LlamaIndex, Haystack, Agno, PydanticAI, Google GenAI, and others). It only sees traffic from your own Python process. Agents built in other languages, or calls made by a third-party hosted service you don't run yourself, are outside its capture surface.
Are fixture files safe to commit to version control?
Not by default. fixture.db contains full HTTP request and response bodies, which means API keys and prompt contents whenever they appear in headers or payloads. Add .agent-trace/ and *.db to .gitignore, and never commit a fixture recorded against a production API key. Strip or redact secrets first if you want to keep a fixture as a committed CI test asset.
Is this free to use commercially?
Yes. The project is Apache 2.0 licensed (see LICENSE), which permits commercial use, modification, and redistribution, including inside closed-source products, subject to the license's own attribution and notice terms. There is no separate paid tier or commercial license.
src/agent_trace/_replay/) requires 80% test coverage β correctness-criticalsrc/agent_trace/interceptor/) requires 80% test coverageApache 2.0. Contributions welcome.
Built by Rudrendu Paul and Sourav Nandy
Showcase your server listing on GitHub or your project documentation. Embed this dynamic SVG badge to highlight official listing status and live engagement.
[](https://allmcps.com/mcp/agent-observability-2)<a href="https://allmcps.com/mcp/agent-observability-2"><img src="https://allmcps.com/api/badge/agent-observability-2?style=directory" alt="Agent Observability on AllMCPs" /></a>