# dotplot-mcp
**Category:** 💻 Developer Tools
**Repository:** https://github.com/brownglasses/dotplot-mcp
**Views:** 0
**Installs:** 0
**Upvotes:** 0
**Directory Page:** https://allmcps.com/mcp/dotplot-mcp
## Description
YC's Dot Plot as an MCP server — aha moments, funnels, retention for early-stage founders.
## Claude Desktop Quick Installation
Heuristic fallback — verify the package name and runner against the repository README before running it. Uses `npx` (confidence: low):
```json
"mcpServers": {
"dotplot-mcp": {
"command": "npx",
"args": ["-y","dotplot-mcp"]
}
}
```
## Documentation & README
# Dot Plot MCP
> See individual users, not aggregate charts.
**English** | [한국어](https://github.com/brownglasses/dotplot-mcp/blob/HEAD/README.ko.md)
## Install
Paste this to your agent and it sets everything up:
```
Set up Dotplot (MCP + skills) — instructions are here https://dotplot-reports.vercel.app/setup.md
```
Or do it by hand
```bash
claude mcp add --scope user dotplot -- uvx dotplot-mcp
```
## Use
Say this in any project:
> **"Analyze my product"**
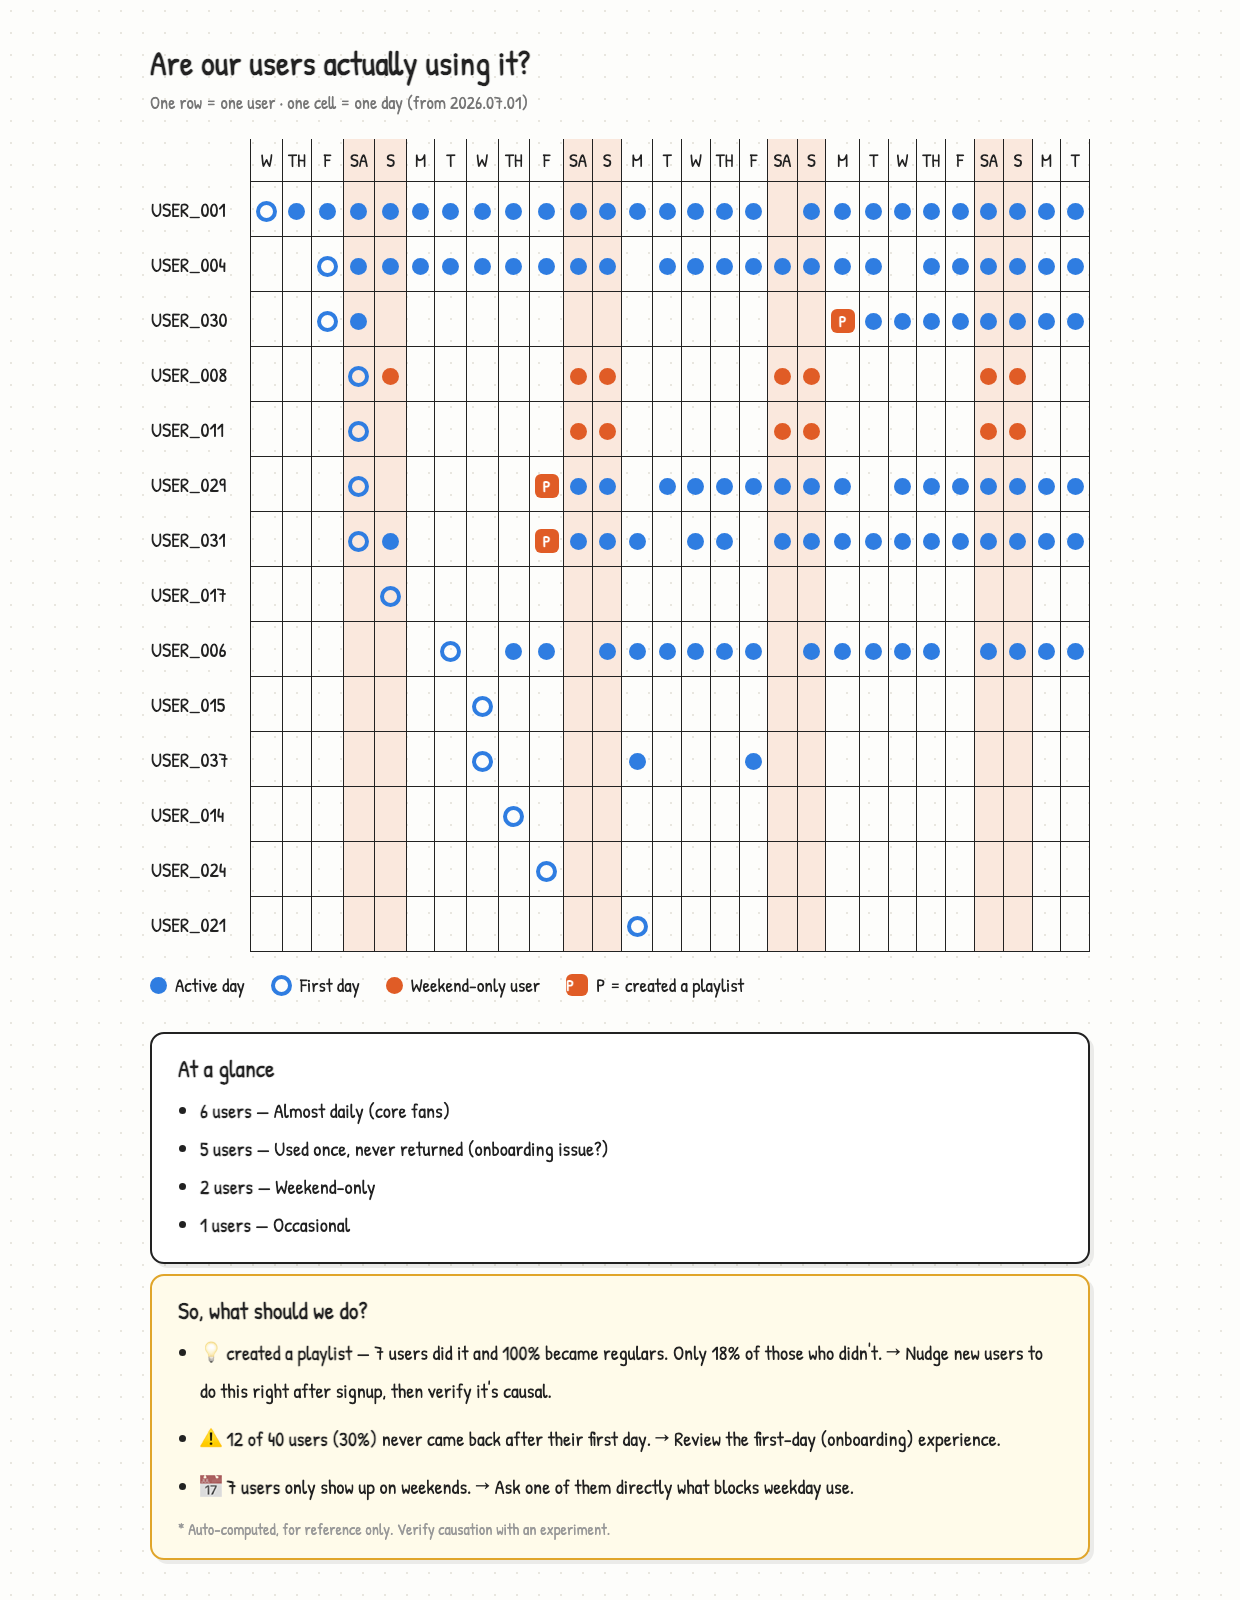
You get the report above. That's it.
Or use the slash commands:
```
/dotplot-analyze-product full analysis and report
/dotplot-add-tracking find and write the logging you're missing
/dotplot-whats-changed compare with the previous report
```
Claude finds your data, picks the action that means "this user got value", and
writes the report. No events table needed — your `orders` table already is one:
```sql
SELECT user_id, created_at::date AS date, 'purchase' AS event FROM orders
UNION ALL
SELECT user_id, added_at::date, 'add_to_wishlist' FROM wishlist_items
```
Nothing tracked yet? Say **"add the tracking I'm missing"** and Claude reads your
code, writes the logging that's absent, and tells you when to come back.
No product to analyze yet? Try the sample
```bash
git clone https://github.com/brownglasses/dotplot-mcp && cd dotplot-mcp
uv run sample_data.py # 40 fake users with a pattern planted in them
uv run harness.py # watch the whole pipeline run
```
## Why this exists
DAU/MAU charts go "up and to the right" as long as new users arrive — even when
nobody stays. Until you have hundreds of users, the most informative dashboard is
[YC's dot plot](https://www.youtube.com/watch?v=e5-6rEwzxLs) (David Lieb):
**one row per user, one cell per day.**
Four rules keep it honest:
- **Code computes, AI only interprets** — same data, same numbers, every time
- **Small samples withhold judgment** — under 5 users in a group, it says nothing
- **Correlation isn't cause** — every finding ships with "test this before you believe it"
- **Vanity metrics are refused** — pick `open_app` as your value event and the code says no
Reports come out in your language (English, 한국어, 日本語 built in; anything else
translated on the fly with the numbers verified intact).
## More
- [What each tool does, and the anonymous benchmark](https://github.com/brownglasses/dotplot-mcp/blob/HEAD/docs/tools.md)
- [How it's built](https://github.com/brownglasses/dotplot-mcp/blob/HEAD/docs/architecture.md)
MIT